Market Data

April 14, 2015
IMF Global Economic Outlook & Forecast
Written by Peter Wright
The following is a global forecast provided by the IMF this week. We provided an abridged statement from the IMF which is then followed by our Steel Market Update data analysis and comments about the future of global and domestic steel demand through 2020. This is a piece normally reserved for our Premium members but we wanted to share it with all of our readers as we try to provide more information about our upstream Premium products.
![]() Overall, global growth is forecast at 3.5 percent in 2015 and 3.8 percent in 2016, broadly the same as last year. But this aggregate number masks the diverse developments. A number of complex forces are shaping the prospects around the world,” says Olivier Blanchard, IMF Economic Counselor and Director of Research. “Legacies of both the financial and the euro area crises—weak banks and high levels of public, corporate, and household debt—are still weighing on spending and growth in some countries. Low growth in turn makes deleveraging a slow process.” Blanchard also notes that the combination of population aging, lower investment, and sluggish advances in productivity will lead to significantly lower potential growth both in advanced and emerging market economies. “More subdued growth prospects lead, in turn, to lower spending and lower growth today,” he says.
Overall, global growth is forecast at 3.5 percent in 2015 and 3.8 percent in 2016, broadly the same as last year. But this aggregate number masks the diverse developments. A number of complex forces are shaping the prospects around the world,” says Olivier Blanchard, IMF Economic Counselor and Director of Research. “Legacies of both the financial and the euro area crises—weak banks and high levels of public, corporate, and household debt—are still weighing on spending and growth in some countries. Low growth in turn makes deleveraging a slow process.” Blanchard also notes that the combination of population aging, lower investment, and sluggish advances in productivity will lead to significantly lower potential growth both in advanced and emerging market economies. “More subdued growth prospects lead, in turn, to lower spending and lower growth today,” he says.
On top of these underlying forces, two major factors, both with major distributional implications, dominate the current scene: the decline in the price of oil and exchange rate movements. “Large movements in relative prices, whether exchange rates or the price of oil, creates winners and losers,” says Blanchard.
Advanced Economies are Doing Better
Global growth in 2015 will be driven by a rebound in advanced economies—forecast to increase from 1.8 percent last year to 2.4 percent this year—supported by the decline in oil prices.
Growth in the United States is projected to exceed 3 percent in 2015–16. Domestic demand will be supported by lower oil prices, more moderate fiscal adjustment, and continued support from an accommodative monetary policy stance, despite the projected gradual rise in interest rates and some drag on net exports from recent dollar appreciation. After weak second and third quarters in 2014, growth in the euro area is showing signs of picking up, supported by lower oil prices, low interest rates, and a weaker euro. And after a disappointing 2014, a weaker yen and lower oil prices are expected to lead to a pickup of growth in Japan.
Emerging and Developing Economies will Slow
Growth forecasts for most emerging and developing economies are slightly worse. Growth is projected to slow from 4.6 percent in 2014 to 4.3 percent in 2015. This reflects a variety of factors. Oil price declines will sharply slow growth for oil exporters, especially those that also face difficult initial conditions —for example, geopolitical tensions in the case of Russia. The Chinese authorities’ emphasis on reducing vulnerabilities from recent rapid credit and investment growth will likely cause a further slowdown in investment, particularly in real estate. Latin America’s outlook will continue to weaken due to lower commodity prices. Brazil’s outlook is also affected by a drought, tighter macroeconomic policies, and weak private sector sentiment. Unlike in advanced economies, windfall gains from lower oil prices are not passed through as directly to consumers in many emerging market and developing oil importers, and this is expected to mute any boost to growth. Instead, the benefits of lower oil prices are expected to accrue more to governments (for example, in the form of savings from lower energy subsidies), and so they may be used to shore up public finances. Growth in low-income countries as a group, however, has stayed high. Growth is expected to slow only slightly to 5½ percent in 2015, from 6 percent in 2014, and then to rebound in 2016, partly thanks to increased external demand from advanced economy trading partners.
Risks to Outlook More Balanced
Risks to global growth are now more balanced relative to six months ago, but remain tilted to the downside. Macroeconomic risks have slightly decreased (e.g., recession and deflation in euro area), but financial and geopolitical risks have increased. On the upside, the decline in oil prices could provide a greater boost to global growth than anticipated. Nevertheless, the following downside risks continue to remain relevant:
• A further sharp dollar appreciation could trigger financial tensions elsewhere, particularly in emerging markets.
• Disruptive asset price shifts remain a concern amid low term and risk premiums in bond markets. As the environment for these asset price configurations—very accommodative monetary policies and large output gaps in advanced economies—is changing, there is scope for surprises and strong market reactions.
• Geopolitical tensions, stemming from ongoing events in Ukraine, the Middle East, and West Africa, could generate regional and global spillovers.
• Stagnation and low inflation in advanced economies, notwithstanding the recent upgrade to the near-term growth forecasts for some of these economies, could hamper the recovery.
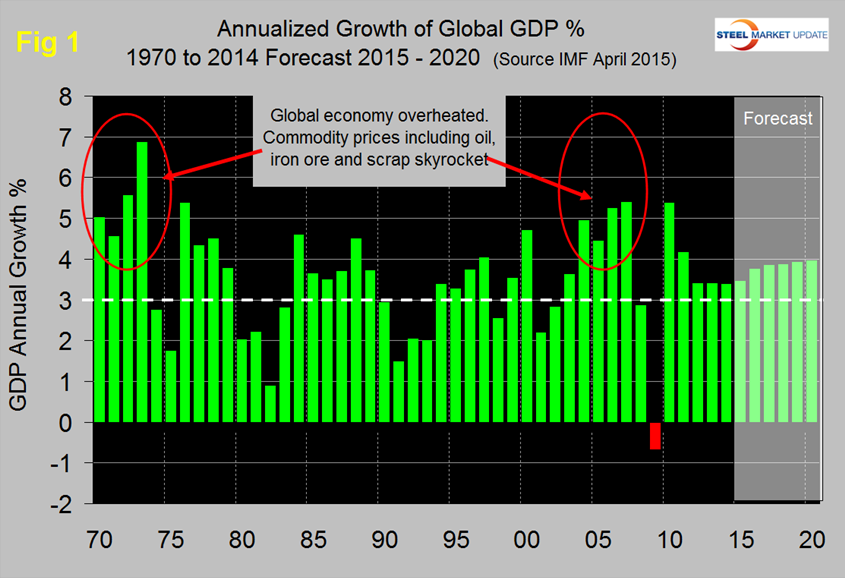
SMU Data Analysis: Figure 1 shows the growth of global GDP since 1970 with this month’s IMF forecast through 2020.
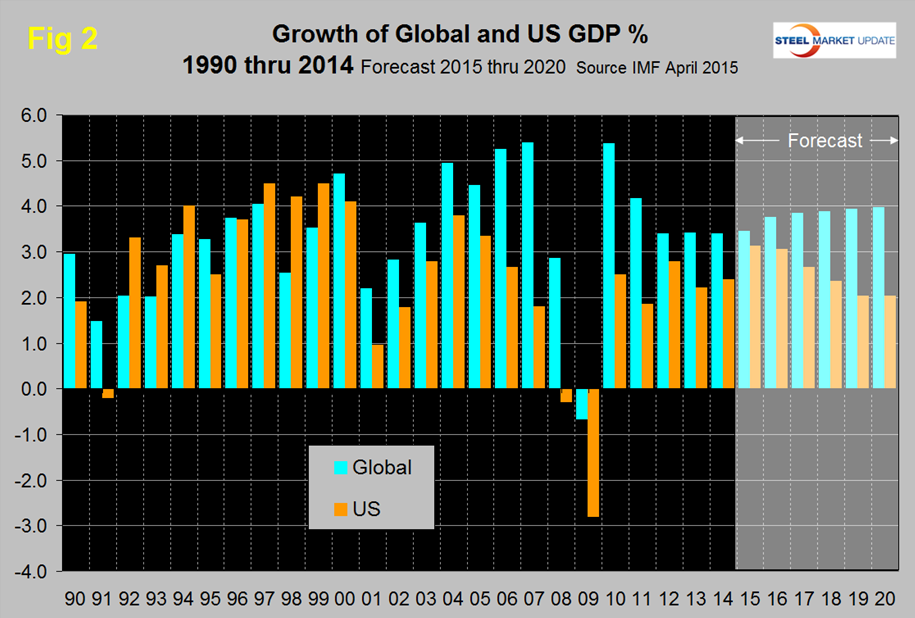
We have highlighted the periods of the early 70’s and the mid 00’s when the commodity bubbles prevalent at those times were driven by unusually high and sustained global growth. The collapse of the commodity bubble in the last decade coincided with the US banking and housing crisis setting up the perfect storm. Global growth has been unusually flat in the years 2012 through 2014 and forecast for 2015 followed by a forecasted slow growth through 2020. Prior to the 2001 recession, the US held its own in the economic growth stakes but between 2001 and 2008, growth in the US averaged 1.84 percent less per year than the growth of the global economy as a whole (Figure 2).
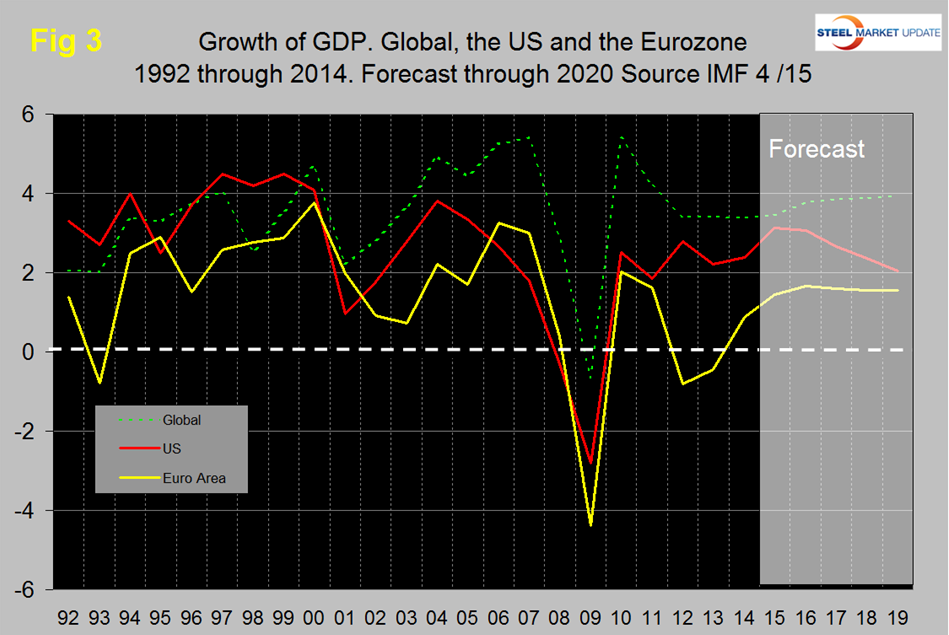
In the years 2011 through 2013 that gap narrowed to 1.36 percent. Global growth is now forecast to gradually climb back to 4.0 percent in 2020, the discrepancy with US widening again. The US has outperformed the Eurozone in every year since 2008 and is forecast to continue to do so through 2020 (Figure 3).
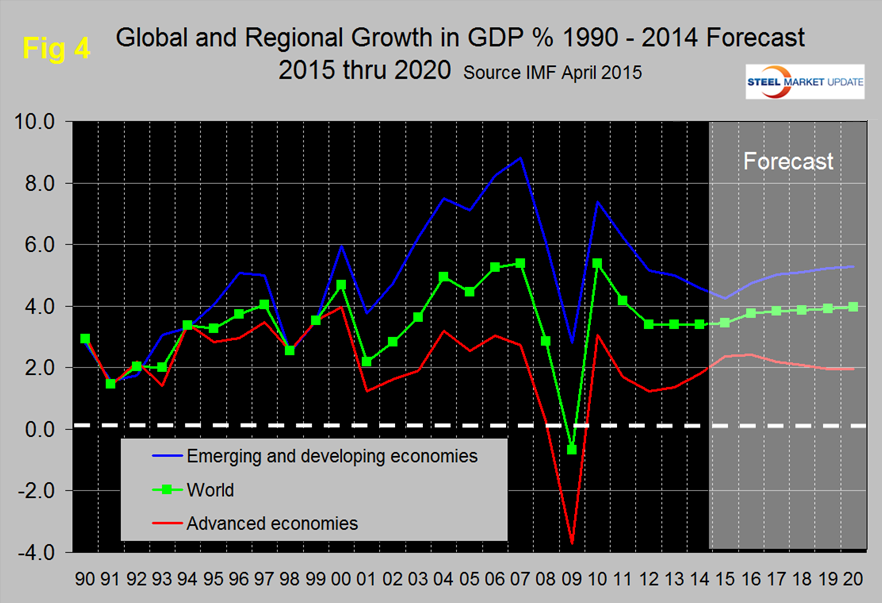
The gap will narrow as we approach the end of this decade. Figure 4 shows the growth comparison between emerging and developing economies and the advanced economies, that gap is projected to widen in the second half of this decade.
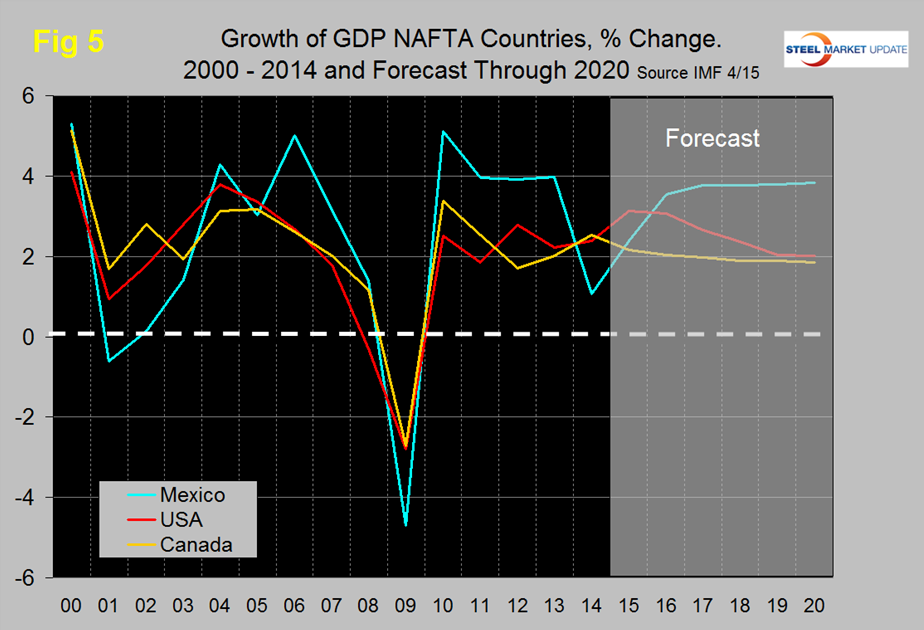
Within NAFTA, Mexico had the lowest rate of growth in 2014 but is forecast to re-take the lead next year and to widen the gap with the US through the end of the decade (Figure 5). Canada is forecast to be relatively flat in that time period.
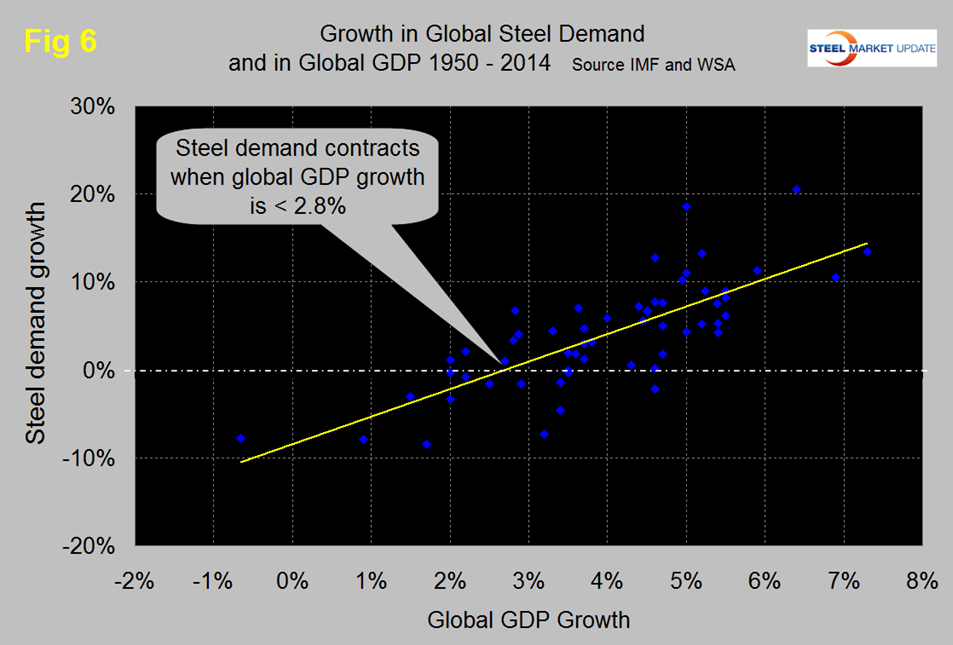
There is a relationship between the growth of GDP and steel demand at both the international and national level which also extends to other commodities such as cement. There are two interesting aspects to this relationship. First, the cyclical change in steel demand is vastly more volatile than the change in GDP which we attribute to the inventory response throughout the supply chain. Secondly, as discovered by our friends at “Steel Guru,” 1 percent growth in GDP does not result in 1 percent growth in steel demand. At the global level it takes a 2.8 percent increase in GDP to get any increase in steel demand (Figure 6).
This is a long term average over a period of 65 years and based on the added volatility of steel can be a predictor of the immediate future. For example, after the disastrous decline in steel demand in 2009 there was no doubt that a huge cyclical rebound would occur as inventory managers throughout the world began to react to the economic recovery. If the IMF forecast proves to be correct, then the growth in steel demand through 2020 will be around 3 percent. This is considerably better than current World Steel Association data through February 2015 and will help to mop up some of the global steel overcapacity. In the US steel market it requires about 2 percent growth in GDP to generate growth in steel demand therefore, again, if current forecasts prove to be correct regarding the US economy we can expect steel demand to expand in 2015 and 2016 then tail off as we approach 2020.
If you would like to learn more about our Premium level products, get pricing on Premium memberships (we have special deals for existing Executive customers) or request a trial of the Premium product please contact us at 800-432-3475 or by email at: info@SteelMarketUpdate.com.


