Market Data

April 6, 2015
Job Gains Slipping Away
Written by Peter Wright
The Bureau of labor Statistics, (BLS) reported on Friday: “Total non-farm payroll employment increased by 126,000 in March, and the unemployment rate was unchanged at 5.5 percent. Employment continued to trend up in professional and business services, health care, and retail trade, while mining lost jobs. The change in total non-farm payroll employment for January was revised from +239,000 to +201,000, and the change for February was revised from +295,000 to +264,000. With these revisions, employment gains in January and February combined were 69,000 less than previously reported. Over the past 3 months, job gains have averaged 197,000 per month.”
SMU Analysis: The three month moving average (3MMA) of gains through March at 197,000, was down from 265,000 in February. The 3MMA in December was 324,000 the highest since May 2000, (Figure 1).
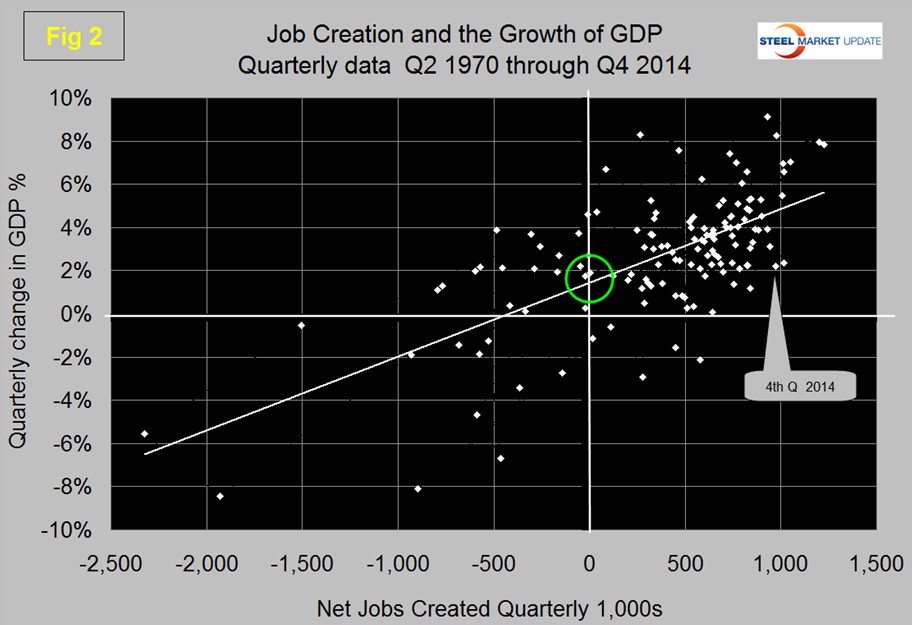
Total non-farm payrolls are now 2,818,000 more than they were at the pre-recession high of January 2008. In the last twelve months the average monthly job creation has been 261,000 per month. All numbers in this analysis are seasonally adjusted by the BLS. The growth of GDP in Q4 2014 based on the 3rd estimate was 2.2 percent and Q1 2015 is forecast to be as low as 1.0 percent. There is a 0.656 correlation between GDP growth and net job creation, (Figure 2).
Job creation in Q4 2014 and by extension through Q1 2015 was much higher than the relationship with GDP suggests, meaning that we can expect a decline in job creation in the current 2nd Q of 2015. The intersect between GDP and job creation shown in Figure 2 looks very much like the relationship between the growth of both steel and cement consumption and GDP. It is necessary to achieve a GDP growth of around 2 percent to get any growth in employment or in steel or in cement. We don’t understand the reason for these intercepts but they appear to be a long term fact.
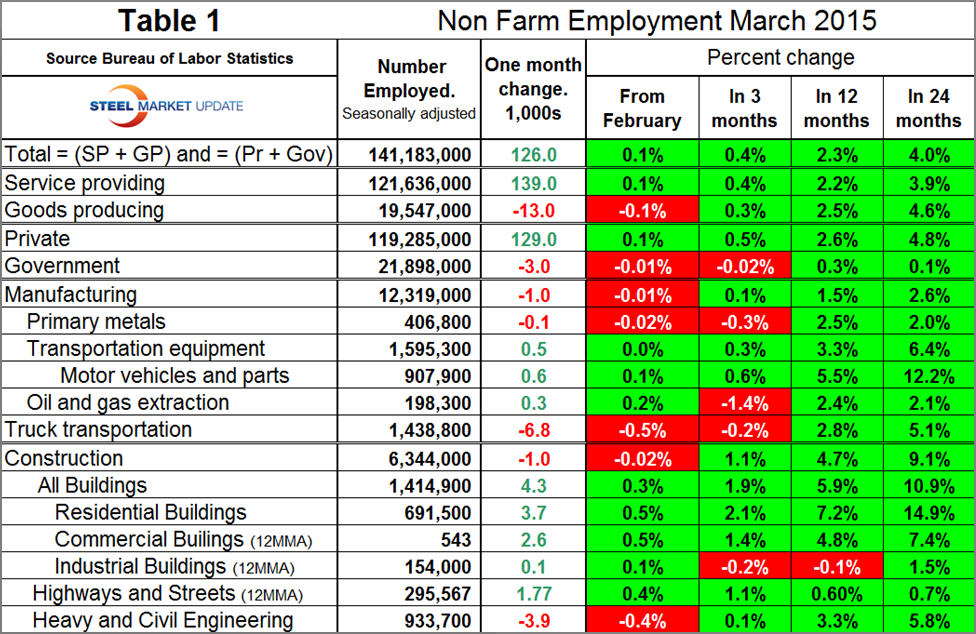
Table 1 slices total employment into service and goods producing industries and then into private and government employees. Total employment equals the sum of private and government employees. It also equals the sum of goods producing and service employees. Most of the goods producing employees work in manufacturing and construction and these sectors are further subdivided in Table 1.
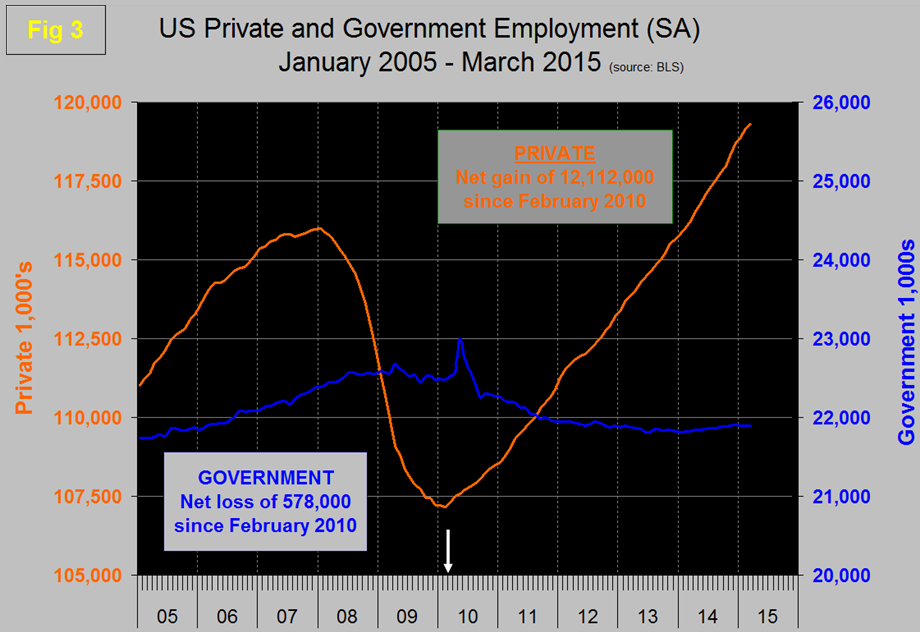
In March private employment grew by 129,000 and government declined by 3,000. Since February 2010, the employment low point, private employers have added 12,112,000 as government has shed 578,000, (Figure 3).
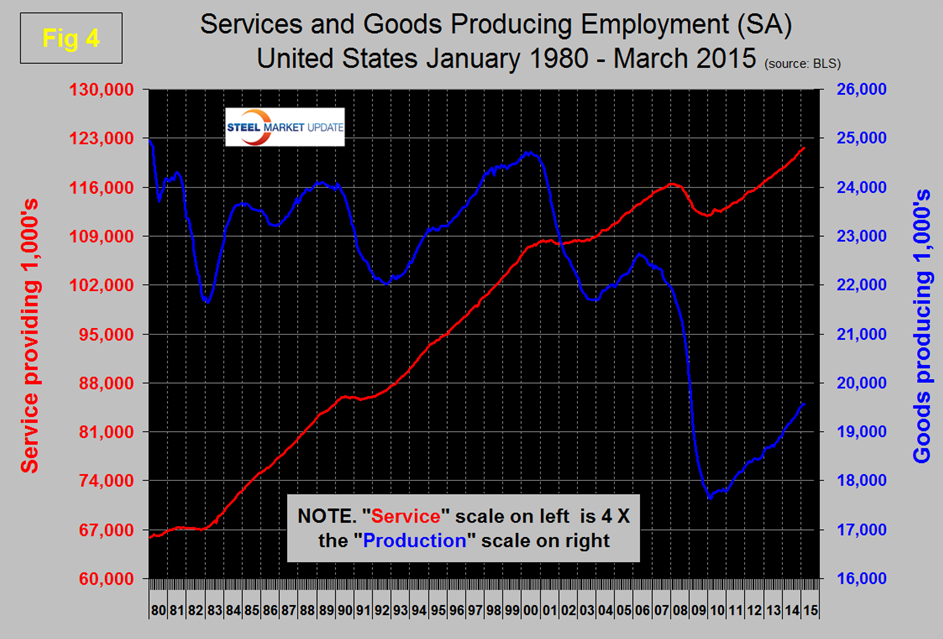
In March service industries expanded by 139,000 and goods producing lost 13,000 people. Of the losses in goods producing, 11,000 were in mining and logging which are not broken out in Table 1. Since February 2010, service industries have added 9,614,000 and goods producing 1,920,000 positions, (Figure 4).
Manufacturing lost 1,000 jobs in March. Truck transportation was down by 6,800, the first negative in this sector since December 2013. Transportation equipment which is mainly motor vehicles and parts added only 500 jobs in March continuing a string of four months of weak performance. Note that Table 1 only identifies the major sectors in manufacturing and construction so the totals don’t add up.
Construction also lost 1,000 jobs in March. All sub components of buildings had positive growth by heavy and civil engineering lost 3,900 jobs. An examination of Table 1 suggests that the result for total buildings compared to the individual results for residential, industrial and commercial looks too high. How can that be? The problem is that industrial and commercial buildings are reported one month in arrears so we have to work around that.
The Association of General Contractors of America reported last week; “Construction declined by 1,000 in March but is still up by 282,000 compared to the prior year, as the sector’s unemployment rate fell to 9.5 percent. Association officials noted that declining demand for residential and public sector projects offset gains in other areas to contribute to the overall month job losses.”
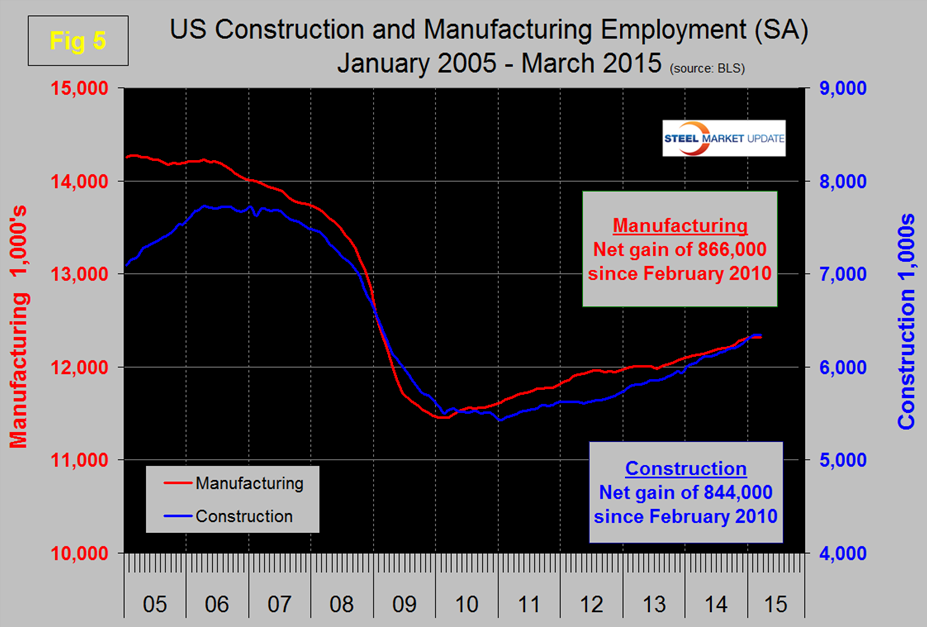
Since the bottom of the employment recession, manufacturing has added 866,000 jobs and construction has added 844,000 jobs, (Figure 5). Construction is catching up rapidly after a slower initial recovery from the recession and should soon pass manufacturing as a job creator since the recession turnaround. This bodes well for the sector that has been holding back steel demand.
The collapse of the price of oil is now showing up in the employment statistics with a 1.4 percent reduction in the number employed in this industry in the last three months.
The official unemployment rate held steady at 5.5 percent in March. This number known as the U3 rate doesn’t take into consideration those who have stopped looking. The more comprehensive U6 unemployment rate decreased from 11.0 percent in February to 10.9 percent in March, (Figure 6). U6 includes workers working part time who desire full time work and people who want to work but are so discouraged that they have stopped looking. The differential between these rates was usually less than 4 percent before the recession. Since January the differential has declined from 6.1 percent to 5.4 percent, the gap is slowly closing.
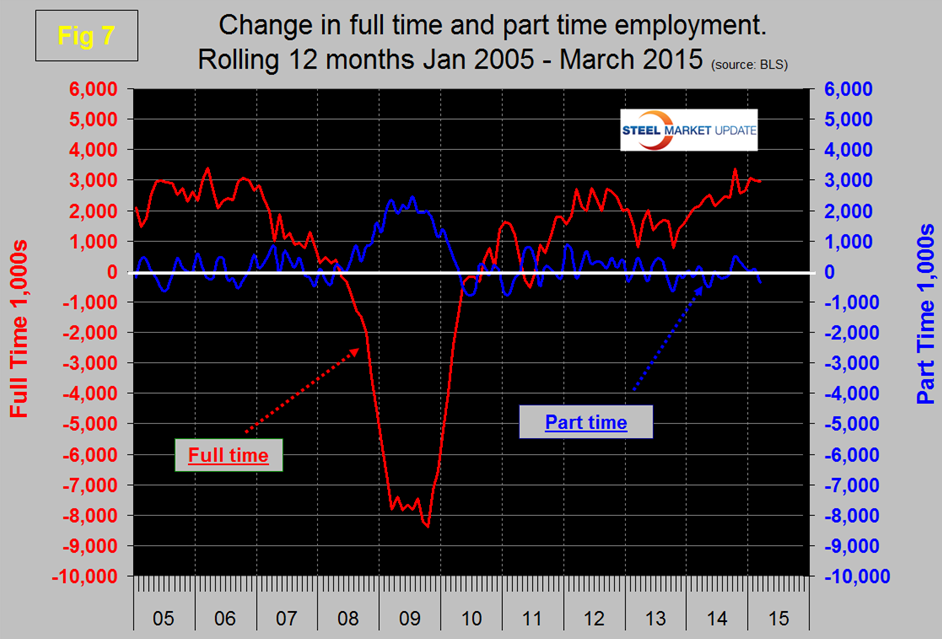
We read a lot in the press about full time and part time job growth, the reporting of which generally appears to us to be inaccurate. This data set is extremely erratic month to month so commentators can often pick up on a single number and run with it. At SMU we have concluded that the only way to get a realistic picture is to examine a 12 month rolling average which screens out most of the variability. By this reckoning the growth of part time employment hasn’t changed much in the last four years, the majority of the growth having been in full time, >35 hours per week, (Figure 7). Since February 2010 the increase in full time employment has been 10,266,000 jobs as part time employment is down by 316,000 jobs.
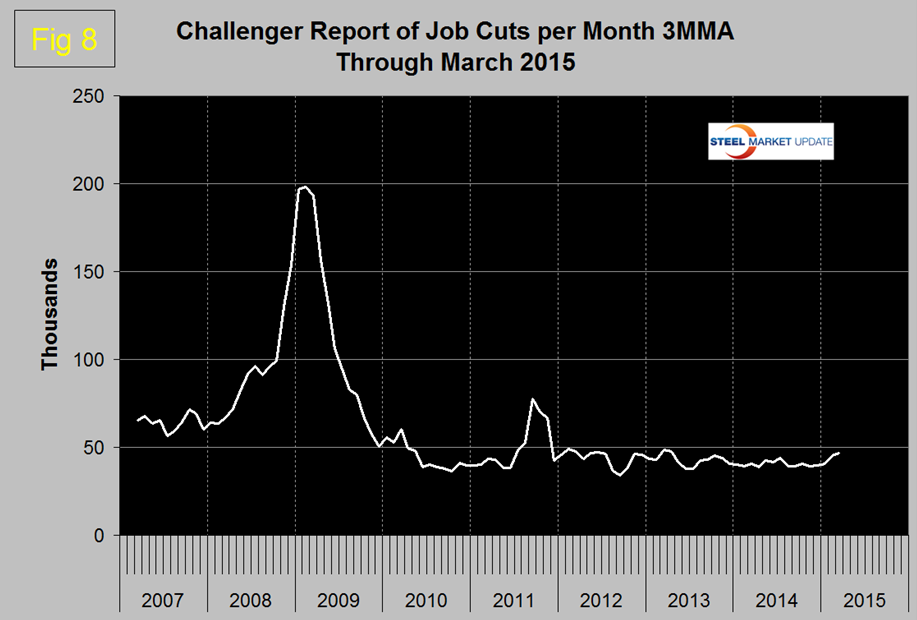
The global outplacement consultancy Challenger, Gray & Christmas, Inc. reported that employers shed 36,594 job positions in March. The full year of 2014 had the lowest total since 1997 but on a year over year basis monthly layoffs are trending up.
Our analysis reports a three month moving average and on this basis the layoffs are up by 15.6 percent year over year, (Figure 8).
We include this Challenger, Gray & Christmas analysis as a reality check for the government statistics.
2015 March Job Cut Report: 34 percent of Q1 Cuts Due To Oil Prices
Following two consecutive months of job cuts in excess of 50,000, the pace of downsizing slowed significantly in March, as US-based employers announced plans to trim payrolls by 36,594 during the month, according to new figures released Thursday by global outplacement consultancy Challenger, Gray & Christmas, Inc.
The March total was 27.6 percent lower than the 50,579 job cuts in February. It was the lowest monthly total since December, when 32,640 were announced.
Despite last month’s decline, the March figure was 6.4 percent higher than the same month a year ago (34,399), making it the fourth consecutive year-over-year increase.
Through the first quarter of 2014, employers announced 140,214 job cuts, up 15.6 percent from the 120,341 cuts tracked the first three months of 2014. The first quarter saw 17 percent more job cuts than in the final quarter of 2014, when 119,763 job cuts were recorded. Of the 140,214 job cuts announced in the first quarter, 47,610 were directly attributed to falling oil prices.
“Without these oil related cuts, we could have been looking one of lowest quarters for job-cutting since the mid-90s when three-month tallies totaled fewer than 100,000. However, the drop in the price of oil has taken a significant toll on oil field services, energy providers, pipelines, and related manufacturing this year,” said John Challenger, chief executive officer of Challenger, Gray & Christmas.
First quarter job cuts were dominated by the energy sector, where employers announced 37,811 job cuts in the first three months of 2015. The three-month total is up a whopping 3,900 percent compared to a year ago, when fewer than 1,000 energy cuts were reported.
“Oil companies are not the only energy-related firms who are getting hit this year. Coal mine closings in West Virginia and elsewhere around the country are also costing jobs,” noted Challenger.
The good news is that the pace of energy-sector job cuts appear to be slowing. Only 1,279 job cuts were announced by energy firms in March, which is 92 percent fewer than the 16,000 announced in February.
The retail sector has tallied the second highest number of job cuts this year, with 22,502 planned layoffs through the first three months of 2014. That figure includes 6,640 in March, most of which were due to a major announcement from Target.
While energy and retail top the year-to-date job-cut tallies, the heaviest job cutting in March occurred among industrial goods manufacturers, whose payroll reductions totaled 9,383 during the month. That brings the sector’s 2015 total to 17,738, which ranks third among all industries.
“Oil prices impacted energy firms directly at the end of 2014 up until February. Now, peripheral manufacturers are losing contracts and laying off workers in an effort to limit major losses,” noted Challenger.
The flip side of losses due to oil prices appear to be occurring in automotive and transportation hiring. Automotive manufacturers announced over 7,000 new jobs so far this year, according to Challenger tracking. That is up from just over 2,000 by this time last year. Meanwhile, companies in the transportation sector have announced over 6,700 new jobs, compared to just over 2,000 through the first quarter of 2014.
“This is just a fraction of the actual hiring occurring across the country, but a jump in these numbers suggest auto and transportation companies are benefitting by the oil slump which could ultimately positively impact consumers,” said Challenger.


