Analysis

March 23, 2015
US Vehicle Sales and NAFTA Vehicle Production Analysis for February 2015
Written by Peter Wright
On a seasonally adjusted annual rate, light vehicle sales weakened in February to 16.2 million units, down from 16.7 million units in January but still up by 5.2 percent from February last year. The probable cause was inclement weather at the end of the month. Analysts had been expecting sales at a 16.7 million annual rate. The decline was most evident for automobiles which declined from 7.5 to 7.2 million. Light truck sales were down from 9.1 to 9.0 million units. Import market share was steady at 21 percent. Moody’s Analytics expects vehicle sales to reach 17 million units in 2015 as a whole, up from 16.4 million units in 2014 as pent-up demand is satisfied, sales will then recede in subsequent years.
Total light vehicle (LV) production in NAFTA in February was at an annual rate of 16,153,560 units, up by 233,928 from January or 1.0 percent. On average since 2004, February’s production has been 7.8 percent higher than January (Figure 1).
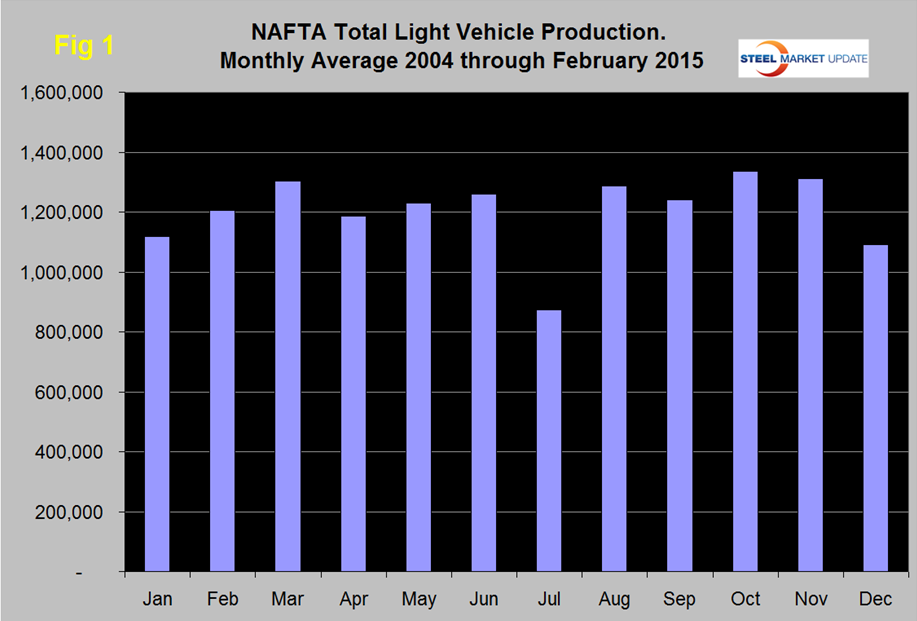
Note: these production numbers are not seasonally adjusted, the sales data reported above are seasonally adjusted. History predicts that production will increase in February and March before declining by 9 percent in April. Ford has now begun production of the aluminum bodied F150 in Kansas City following Dearborn’s start up in December. Together the two assembly lines can produce 700,000 F150s per year. Retooling Kansas City took 13 weeks and cost $1.3 billion.
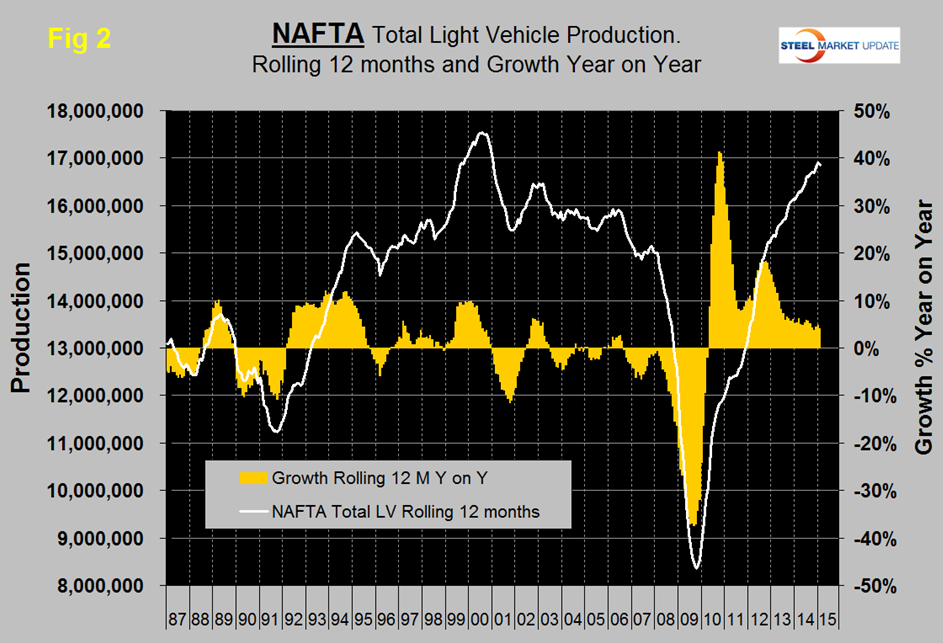
On a rolling 12 months basis y/y LV production in NAFTA increased by 4.1 percent through February. Note this is exactly the same as the growth of industrial production in the US through February. LV production in NAFTA is now well above the pre-recession peak of Q2 2006 and is heading for the all-time high of mid-2000 (Figure 2).
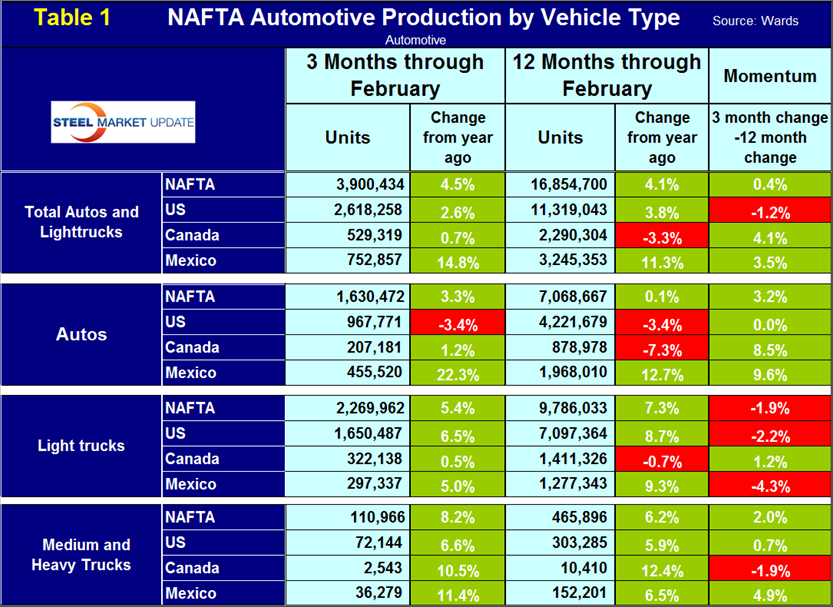
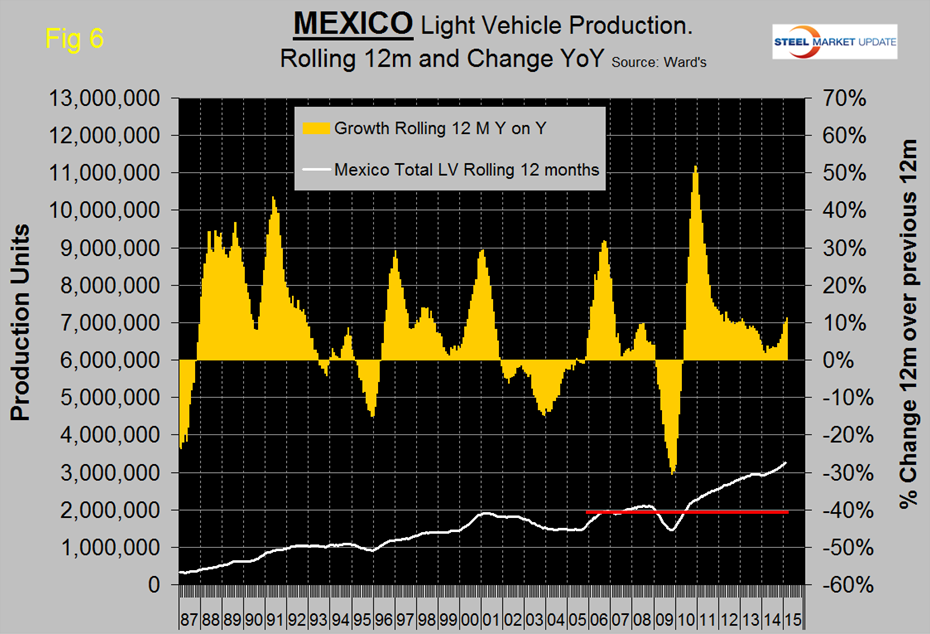
On a rolling 12 months basis y/y the US is up by 3.8 percent, Canada is down by 1.2 percent and Mexico is up by 11.3 percent (Table 1).
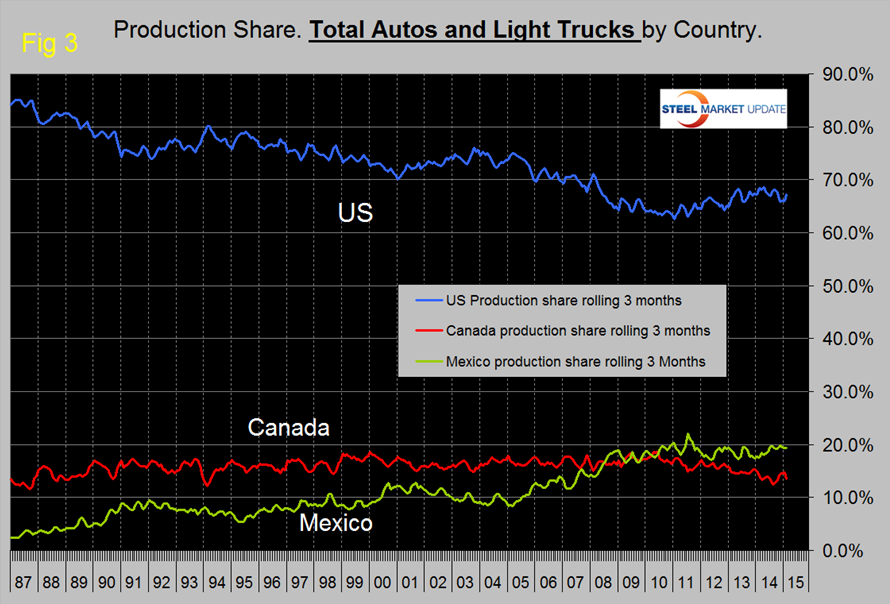
We are reminded this month how easy it is to spin complex data like this to get a variety of results. It is true as we have reported in the past that the US has gained production share in the most recent 3.5 years (Figure 3), but if we take an arbitrary date such as the previous peak of LV production in Q2 2006 as shown in Figure 1 and examine the growth in total by vehicle type and by country since then we get a very scary result as far as the US and Canada are concerned.
This is demonstrated in Table 2 on a rolling 12 month basis and shows that LV production in NAFTA is up by 6.0 percent, the US is down by 0.4 percent, Canada is down by 13.4 percent and Mexico is UP by 71.8 percent.
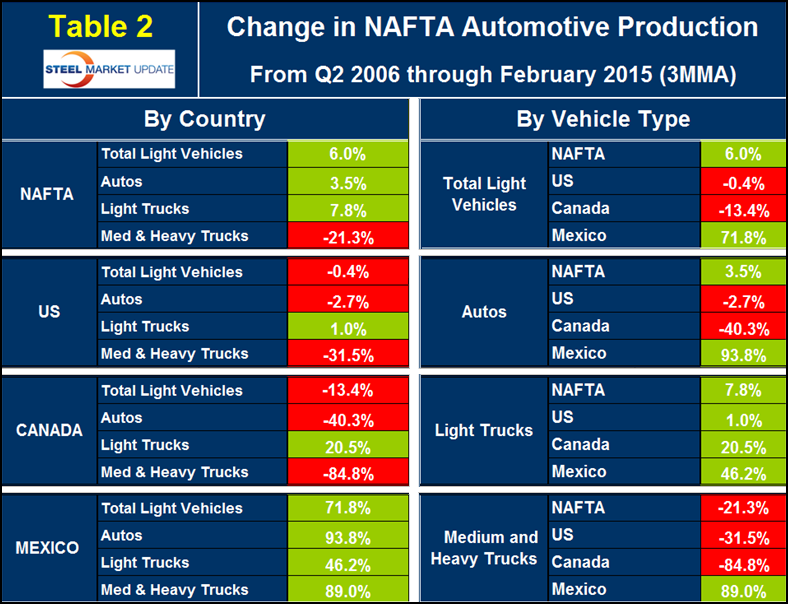
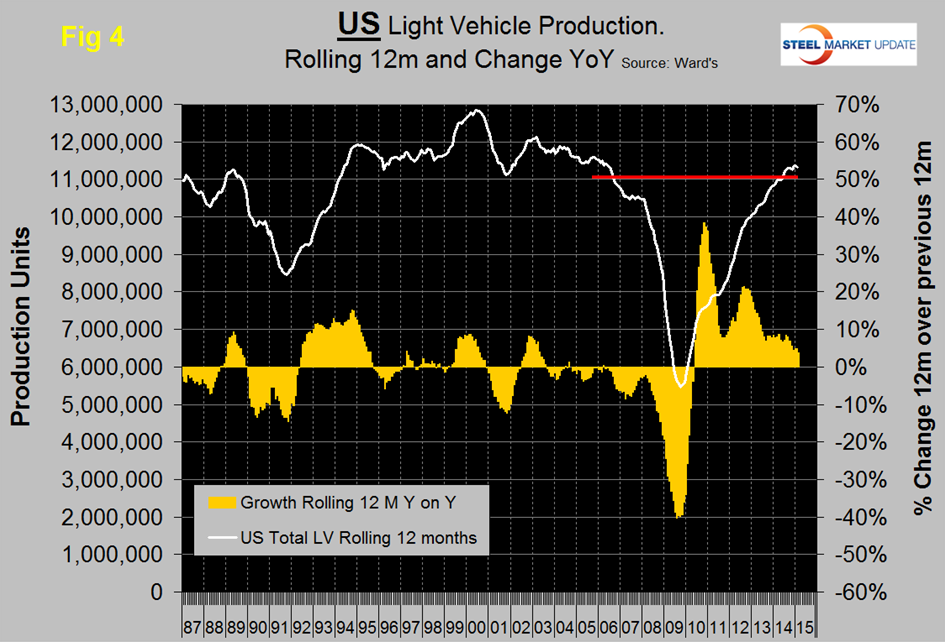
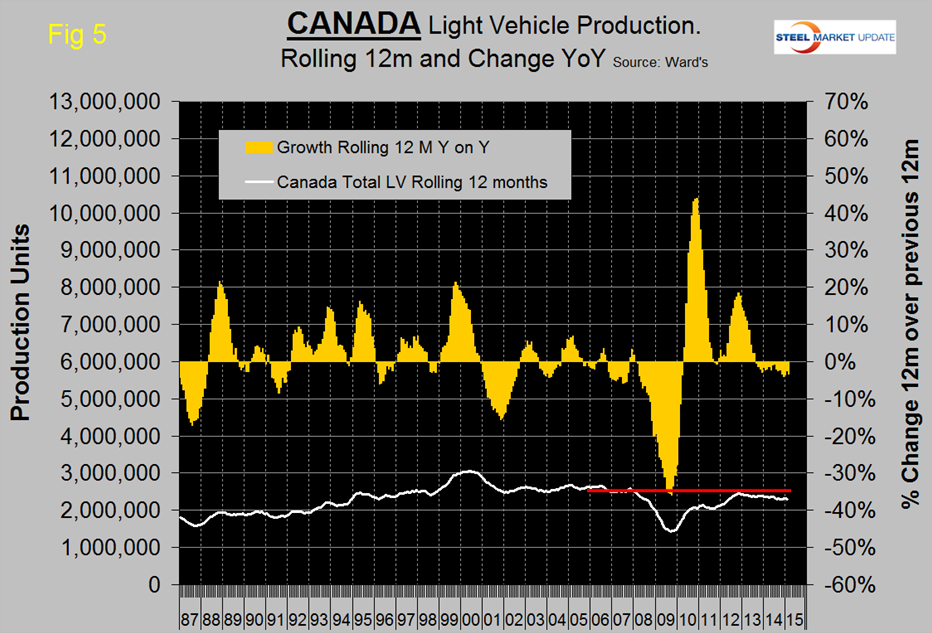
Figure 4, Figure 5 and Figure 6 show total LV production by country with year over year growth rates and on each the red line shows the change in production since Q2 2006. Note the scales are the same to give true comparability and that Mexican growth is surging at twice the rate in the US and Canada continues to contract.
We at SMU are wondering if the recent loss in value of the Peso is causing auto assemblers to move production to Mexico. We believe there is spare capacity both sides of the border for the automotive manufacturers to play this game. This isn’t happening in Canada in spite of the depreciation of the Loonie because, (in our opinion) the labor relations situation in Canada is causing manufacturers in general to reduce their exposure. US steel is a case in point.
Some good news for the US is that last week Mercedes announced plans to invest $500 million to build a new assembly line in Charleston SC to build the Sprinter van. Construction will begin next year.
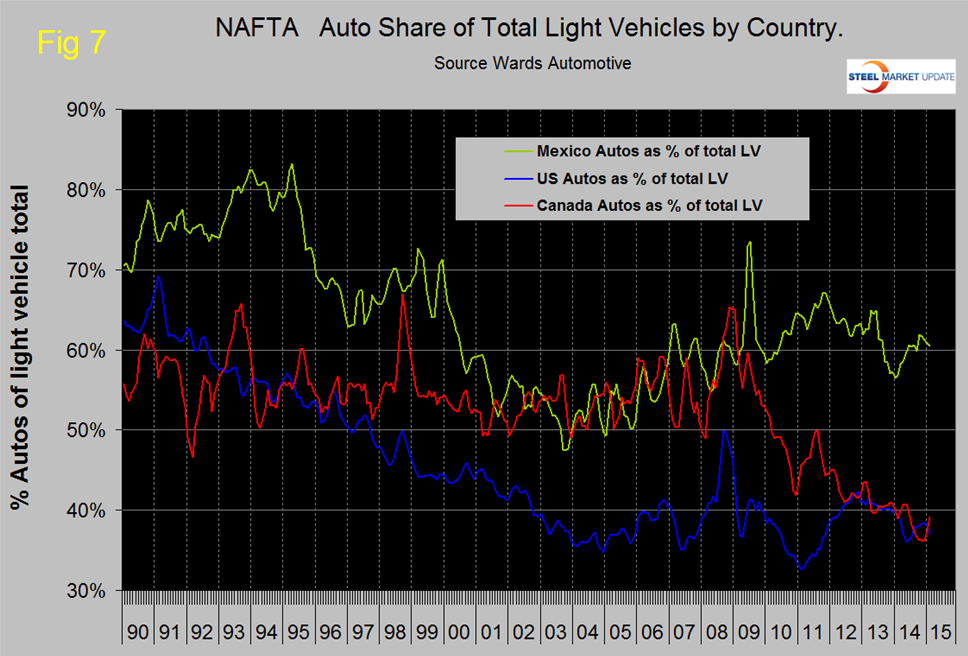
The mix of light vehicles is very different by country (Figure 7). The percentage of autos in the Mexican mix in the last three months was 60.5 percent but only 37.0 in the US and 39.1 percent in Canada.
Ward’s Automotive reported on Friday that total light vehicle inventories in the US decreased by 12 days of sales from a very high level of 81 in January to 69 in February, 6 days lower than February last year. Month over month FCA (Fiat Chrysler Automotive) was down by 17 days to 85, Ford down by 7 days to 80 and GM down by 18 to 76 days.
The SMU data file contains more detail than be shown here in this condensed report. Readers can obtain copies of additional time based performance results on request if they wish to dig deeper. Available are graphs of auto, light truck and medium and heavy truck production, growth rate and production share by country.