

Market Data

March 15, 2015
Exploratory Rig Counts Collapsing While Production Increases
Written by Peter Wright
The energy sector has been one of the critical steel-using market segments which is impacting the steel industry at this time. There are two separate issues at the moment, exploration and production, and they are moving in opposite directions. The exploratory rig count is collapsing and production is increasing.
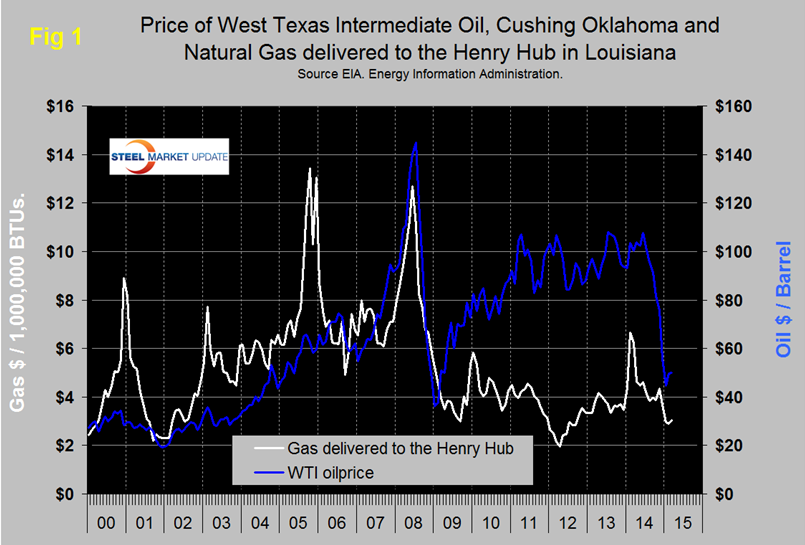
Figure 1 shows historical gas and oil prices since January 2000. The daily spot price of West Texas Intermediate fell below $100 in August and by January 23rd was down to $44.80. By March 9th, the latest daily figure available from the Energy Information Administration, (EIA) the price of WTI had recovered to $49.95. Brent closed at $58.67 on the same day. Natural gas delivered to the Henry Hub in Louisiana fell below $4.00 in August, there was an uptick in November, the slide continued through February then this month through the 6th there was a 14 cent recovery.
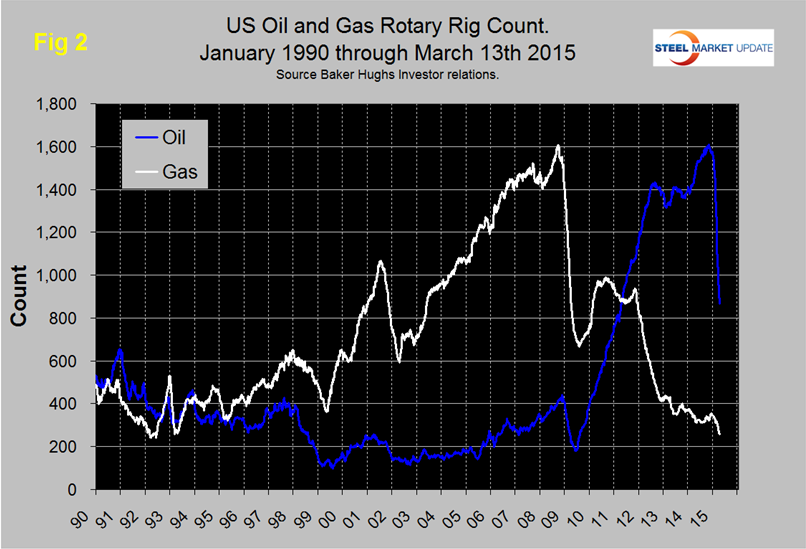
Gas and oil prices are reflected in the drill rig count. Figure 2 shows the Baker Hughes North American Rotary Rig Count which is a weekly census of the number of drilling rigs actively exploring for or developing oil or natural gas in the United States and Canada. Rigs are considered active from the time they break ground until the time they reach their target depth and may be establishing a new well or sidetracking an existing one. The Baker Hughes Rotary Rig count includes only those rigs that are significant consumers of oilfield services and supplies. Figure 2 shows that the oil rig count which had been trending flat for almost two years, accelerate in 2014 until October 10th when it reached 1,609 and has since responded to the collapsing oil price by declining to 896. Through March 13th there was no slowdown in the rate of decline of oil rigs. The gas rig count has fallen by 87 from this time last year and now stands at 257 a level not seen since June 1992.
The total number of operating rigs is now 1,125 a decrease of 233 in the last month. Land rigs decreased by 229 to 1,077 and off shore by 4 to 48. Of the 48 rigs exploring for oil off shore, 45 are off the Louisiana coast. There is only one rig operating off the Texas coast and none off of California or Florida. On a regional basis, the big three states for operating rigs are Texas, Oklahoma and North Dakota. Texas at 500 on March 13th was down by 98 in the last month and by 44 percent since September 26th. On the same basis, Oklahoma at 134 was down 37 and 37 percent and North Dakota at 101, down 22 and 47 percent.
Armada Executive Intelligence made the following comments this month.
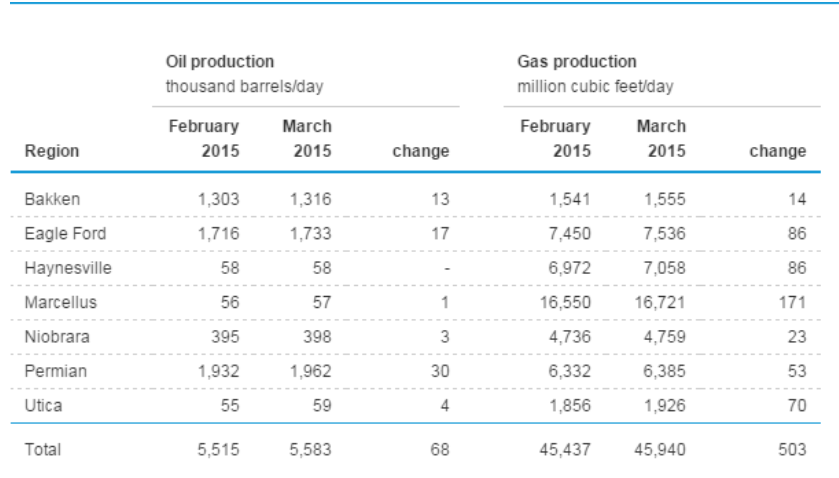
First, many of the drilling rigs in the US that are being pulled out of production are older, less efficient equipment. The producing wells are getting far more out of the same hole and far more cheaply and many speculate that we will see production continue at an 8 percent rate of growth in 2015. Growth was and is currently about 68,000 barrels a day of production in February and March according to the EIA – despite the cuts in drilling, Figure 3. The EIA, (Energy Information Agency) anticipates that US oil production will continue to increase on a barrel per day basis through this year.
Second, we don’t ever see the additional bits of storage that are being filled up around the world. Although we don’t have a list of the tankers sitting off of coasts completely full, we can get to some of that by looking at maritime tanker rates. We know that there isn’t a lot of global demand for oil at the moment (demand in Europe, Asia, South America, and the US is lower at this time), and supply continues to exceed current demand.
Third, we know that global demand for oil is much weaker than it was just a year ago. China’s consumption has fallen off and stockpiles of oil in the country are growing. China has been one of the countries that has been able to purchase Russian oil to help keep currency flowing in the Russian economy.
SMU’s view is that the changes presently taking place in the global energy markets could change overnight if Saudi Arabia blinks and leads OPEC to cut production. In the meantime, steel demand will be negatively impacted as is already the case for OCTGs.
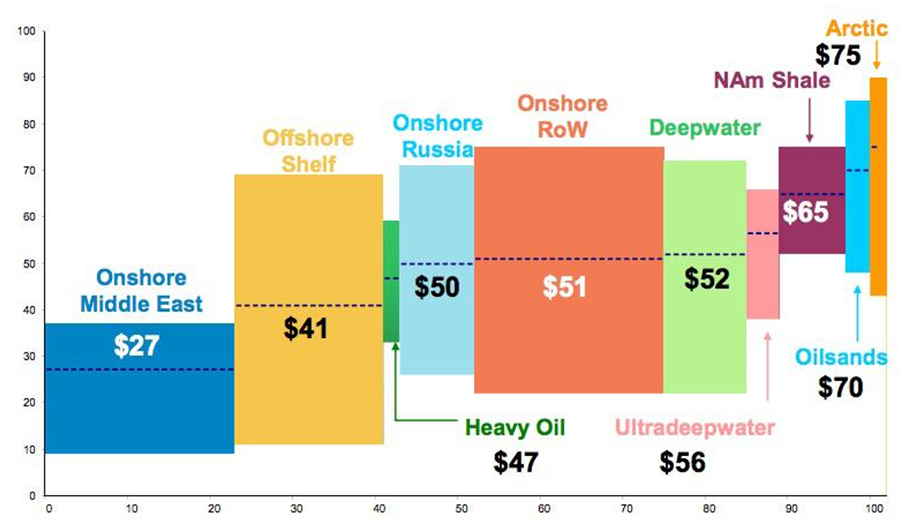
The decline in global oil prices has reduced the incentive to invest in non-traditional wells, (horizontal) which have a much shorter production life cycle than vertical wells. Consequently, this sector will begin to dry up within a couple of years which will close the supply/demand imbalance in the US and, to a lesser extent, globally. Figure 4 shows the range of production costs for various oil producing regions.
Some analysts believe one of Saudi Arabia’s intentions is to shut down fracking in the US; figure 4 shows that they are in the ballpark. Another may be to put pressure on Iran possibly in cahoots with the US government given the current nuclear negotiations. Consumption of natural gas, helped by a more favorable carbon footprint compared to other hydrocarbons will continue to increase in the US. According to the EIA, consumption declined from 8.1 trillion cubic feet in 2000 to 6.2 trillion in 2009, then recovered steadily to 7.7 trillion last year.
Natural gas has a multitude of industrial uses. It is a source of base ingredients for plastics, fertilizer, anti-freeze, and fabrics. Industry is the largest consumer, accounting for 43 percent of the total. Growing consuming sectors include power generation, transportation, direct reduced iron and exports of LNG. On the supply side the US has huge and accessible resources. The geopolitical situation suggests a very favorable future for production and consumption of natural gas in the US however it is unclear how the balance of supply and demand and therefore price will shake out in the balance of this decade.


