Market Data

March 1, 2015
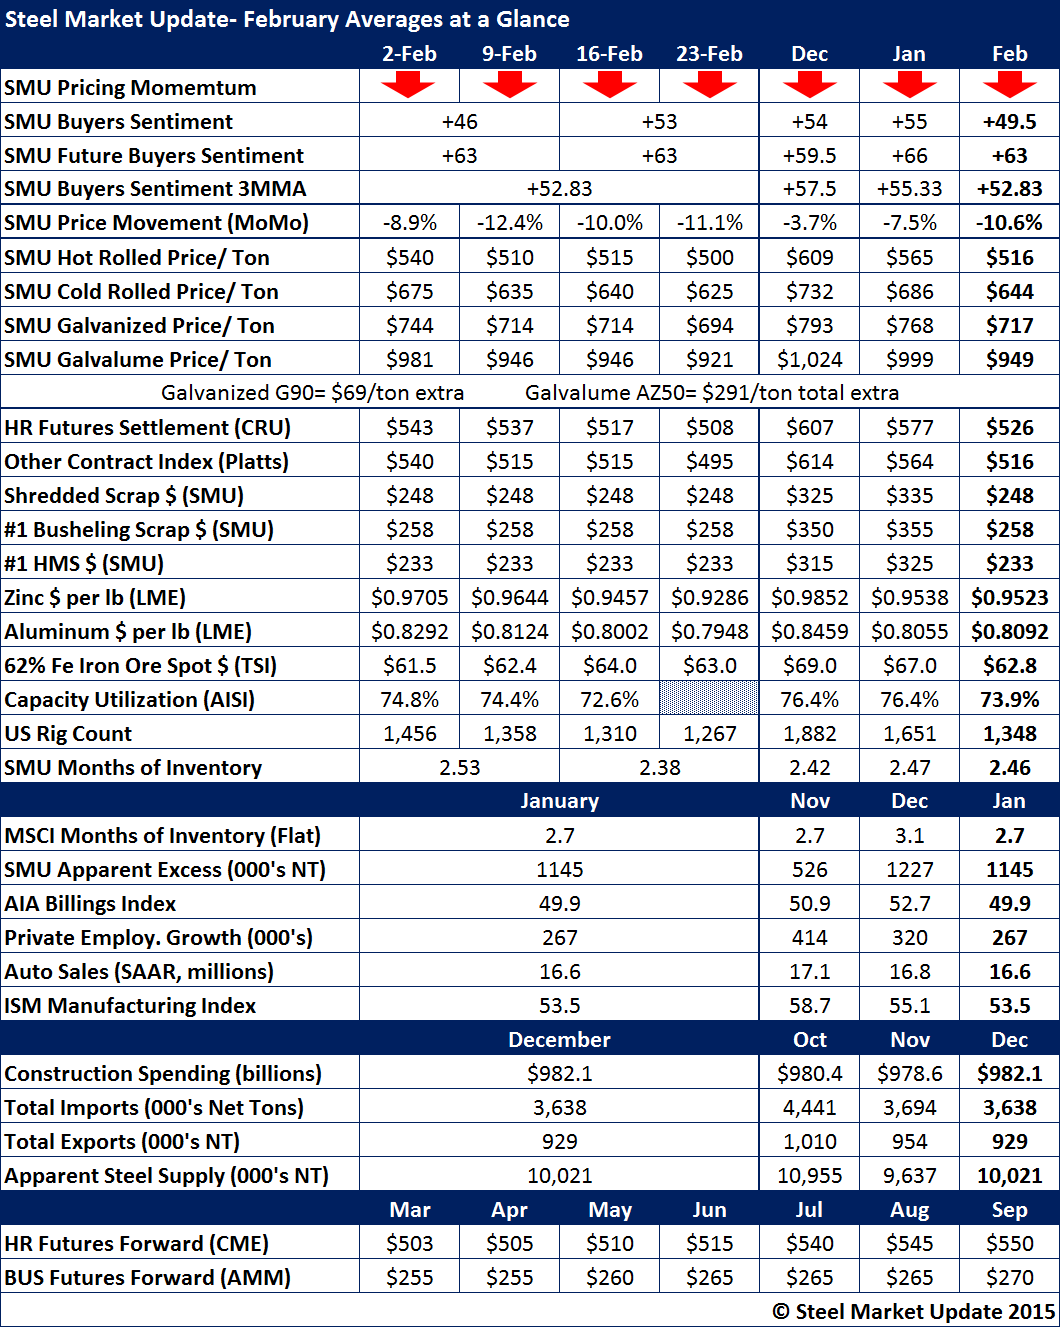
February 2015 Steel Data at a Glance
Written by John Packard
February and its 20 shipping days is now behind us. It is time to take a look at how the data for the month played out.
SMU Price Momentum Indicator ended the month just as it had begun the month (as well as the New Year), pointing toward lower flat rolled steel prices in the coming thirty days.
SMU Steel Buyers Sentiment Index averaged +49.5 for the month but, our index did end the month on an upswing at +53. Our three month moving average (3MMA) continued to decline and stood at +52.83 at the end of February, down 2.5 points from January’s +55.33.
Benchmark hot rolled ended the month averaging $516 over the four weeks reported. We were the same as the Platts average during the same time period. CRU was $10 per ton higher than both SMU and Platts at $526 per ton for the month.
Scrap prices were significantly lower on all products (#1 HMS, shredded and #1 busheling) in the Midwest.
Zinc and aluminum spot prices remained essentially unchanged compared to January.
Capacity utilization rates declined which is not a good omen for the domestic steel mills.
One of the reasons why utilization rates have declined is due to the drop in drilling rigs in the U.S. which averaged 1,882 rigs in January and now are down to an average of 1,348 rigs in February. This is a loss of 534 drilling rigs.
Apparent Excess, which is a Premium product, calculates whether the U.S. service centers are over inventoried or under-inventoried. We saw a slight dampening to the excess inventory levels for flat rolled. Distributor inventories continue to be in excess but are down 82,000 tons compared to the month of January. At 1.1 million tons, service centers still have a long way to go.
The HRC (hot rolled coil) futures forward curve is in contango (prices are higher the further you go out into the future) with September 2015 showing $550 per ton.