Market Data

February 19, 2015
SMU Steel Buyers Sentiment Index: 3MMA Less Optimistic Trend Snapped
Written by John Packard
Steel Market Update (SMU) Steel Buyers Sentiment Index was measured at +53 earlier today based on the results of our most recent flat rolled steel analysis conducted this week. The +53 is 7 points higher than what we reported at the beginning of the month.
Our Steel Buyers Sentiment Index measures how buyers and sellers of flat rolled steel feel regarding their company’s ability to be success in the current market environment. Optimistic readings are those reported to be above zero (+100 is the most optimistic reading possible) while those reported as negative numbers are where we are seeing a very pessimistic market place (the most pessimistic reading would be -100).
We also measure Future Sentiment which measures how buyers and sellers of steel feel about their company’s ability to be success three to six months into the future. The Future Sentiment Index was measured this week at +63 which is unchanged from the beginning of this month and slightly more optimistic than the +56 reported at this time last year.
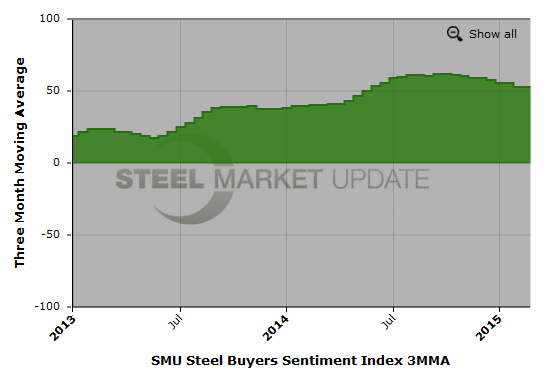
Steel Market Update also looks at our Sentiment Index on a three month moving average (3MMA) basis in order to smooth out the data we are collecting. On a 3MMA Sentiment is +52.83 up slightly from the +52.67 reported at the beginning of February.
More importantly, the 3MMA broke a negative, or less optimistic, slide we had been following since mid-September 2014 when it peaked at +61.83.
Below is a screen shot of using our interactive graphic software, it has been cut down to show the last 2 years of the 3MMA of out Sentiment Index. If you would like to see the other interactive graphics on our Sentiment Index, visit our Steel Buyers Sentiment page here (Note that you must be logged into the website to have access).
What Our Respondents Are Saying
A discrete plate supplier told us, “Consumption is decent however way too much invo in the USA is eroding prices downward along with scrap and other factors. We need to hit the bottom of pricing soon! [I am] predicting $640 [for plate] as the bottom in my estimation.”
A Midwest service center told us, “Although seasonally slow demand remains pretty good.”
Another Midwest based service center reported, “Volumes are good, but margins are terrible.”
A manufacturing company associated with the construction industry said, “Difficult landscape and low returns.”
Another manufacturing company made comments about the pace of the price drop and how that has impacted their foreign purchases,” Domestic pricing has dropped so much, so fast that our imported HDG arriving now is priced above domestic replacement cost.”
From a manufacturer associated with the farm and ranch industry we heard, “Business is strong in the farm and ranch industry.” This company went on to report, “Sales increased 35% over January 2014. Largest January in 50 year history of company.”
About the SMU Steel Buyers Sentiment Index
SMU Steel Buyers Sentiment Index is a measurement of the current attitude of buyers and sellers of flat rolled steel products in North America regarding how they feel about their company’s opportunity for success in today’s market. It is a proprietary product developed by Steel Market Update for the North American steel industry.
Positive readings will run from +10 to +100 and the arrow will point to the right hand side of the meter located on the Home Page of our website indicating a positive or optimistic sentiment.
Negative readings will run from -10 to -100 and the arrow will point to the left hand side of the meter on our website indicating negative or pessimistic sentiment.
A reading of “0” (+/- 10) indicates a neutral sentiment (or slightly optimistic or pessimistic) which is most likely an indicator of a shift occurring in the marketplace.
Readings are developed through Steel Market Update market surveys which are conducted twice per month. We display the index reading on a meter on the Home Page of our website for our members to enjoy. We also have an interactive graphic and tables available for our member companies on our website. You must be logged into the website to see the meter. If you click on the meter you will be taken to the graphics and tables with all of the historical data.
Currently, we send invitations to participate in our survey to almost 600 North American companies. Our normal response rate is approximately 110-170 companies. Of those responding to this week’s survey, 44 percent were manufacturing and 40 percent were service centers/distributors. The balance of the respondents are made up of steel mills, trading companies and toll processors involved in the steel business.


