Analysis

February 15, 2015
Natural Gas & Oil Rig Analysis
Written by Peter Wright
Figure 1 shows historical gas and oil prices since January 2000. The daily spot price of West Texas Intermediate fell below $100 in August and by January 23rd was down to $44.80. By February 9th, the latest daily figure available from the Energy Information Administration (EIA), the price of WTI had recovered to $52.99. Brent closed at $57.00 on the same day. The price recovery is being influenced by the labor unrest orchestrated by the US Steelworkers union at the Gulf coast refineries. The USW represent those workers. Natural gas delivered to the Henry Hub in Louisiana fell below $4.00 in August, there was an uptick in November but since then the price has had an uninterrupted slide to $2.72 on February 6th.
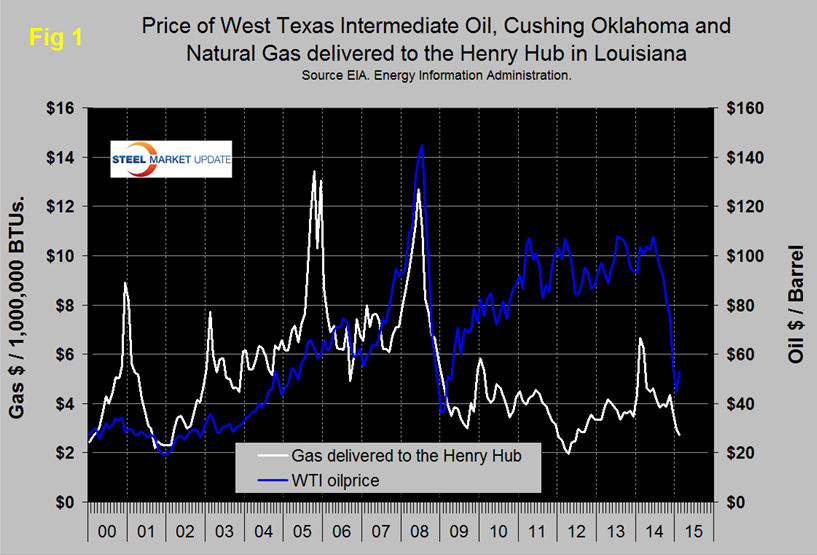
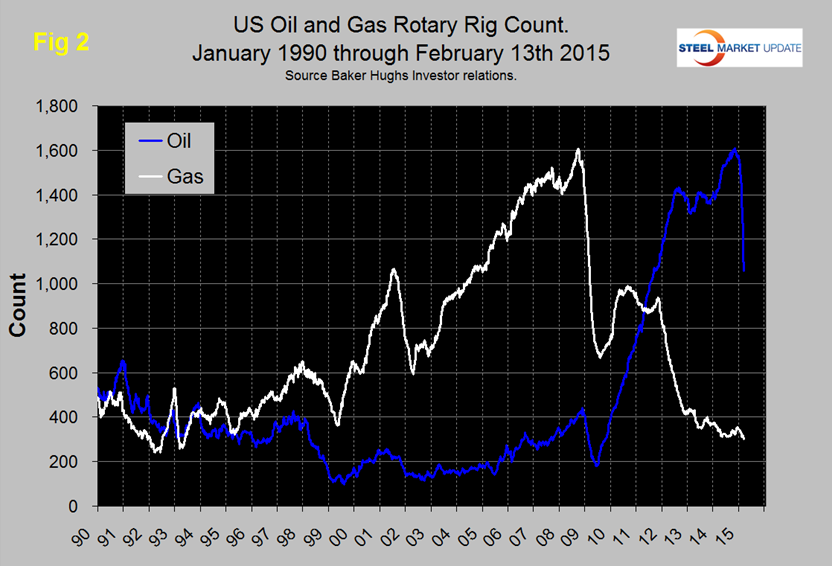
Figure 2 shows the Baker Hughes North American Rotary Rig Count which is a weekly census of the number of drilling rigs actively exploring for or developing oil or natural gas in the United States and Canada. Rigs are considered active from the time they break ground until the time they reach their target depth and may be establishing a new well or sidetracking an existing one. The Baker Hughes Rotary Rig count includes only those rigs that are significant consumers of oilfield services and supplies. Figure 2 shows that the oil rig count which had been trending flat for almost two years, accelerate in 2014 until October 10th when it reached 1,609 and has since responded to the collapsing oil price by declining to 1,056. Through February 13th there was no slowdown in the rate of decline. The gas rig count has fallen by 37 from this time last year and now stands at 300 a level not seen since July 1992.
The total number of operating rigs is now 1,358 a decrease of 318 in the last month. Land rigs decreased by 316 to 1,306 and off shore by 2 to 52. On a regional basis the big three states for operating rigs are Texas at 598, down by 168 in the last month, Oklahoma at 171, down 30 and North Dakota at 123, down 33.
On January 30th Wolf Richter wrote: the oil industry is dead-serious when it talks about slashing operating costs and capital expenditures. It has to. Preserving cash is suddenly a priority, after years when money was growing on trees.
In the US, the cost cutting has reached frenetic levels. One place where it shows up on a weekly basis is the number of rigs actively drilling for oil. And that rig count dropped by 94 to 1,223 in the latest week, as Baker Hughes reported Jan. 30. A phenomenal plunge, by far the worst ever. In January, the rig count crashed by 276, the most ever for a calendar month. That’s 18.4 percent! The rig count is now down 386 from its peak on October 10, by nearly a quarter!
And yet, it’s still just the beginning. The breathless fracking-for-oil boom started years before the financial crisis and ended in a glut and total price destruction that continues to this day. During the financial crisis, the oil rig count fell 60 percent from peak to trough. If this oil bust plays out the same way, the rig count would drop to 642! The bloodletting in the industry would be enormous. But the cutbacks in investments and drilling activities have not yet had any impact on actual production. That is a function of existing wells. New wells are constantly being completed, and their production adds to existing production. So what really needs to happen for the oil bust to end is a decline in production – because demand isn’t picking up the slack. But that just isn’t happening, not yet.
Production continues to rise, internationally and in the US. Oil company by oil company, they’re all projecting further increases in production. They’re cutting drilling activities, they’re laying off people, they’re closing facilities, but they’re pumping as much oil as they can to salvage what’s left of their fizzling cash flow.
The US Energy Information Agency projects production from US wells (except from Alaska and the Federal Gulf of Mexico) to continue rising into 2015 with a tiny bit of tapering toward the end of the year. If the rig count drops by enough, there won’t be enough new wells to make up for dwindling production from legacy wells. That’s when production will begin to taper off.
Meanwhile, rising production in the US, combined with slack demand growth, is ballooning crude oil inventories. In the latest reporting week, these inventories (excluding the Strategic Petroleum Reserve) rose by another 8.9 million barrels to 406.7 million barrels, the highest level for this time of year in “at least the last 80 years,” the EIA reported. These inventory levels are on a terrific upward trajectory that defies the 5-year range and seasonal fluctuations: Every rally in oil over the last six months has gotten hammered down brutally. Eventually, the oil glut will end but at this point we haven’t seen demand pick up or production decline to make a dent and the wave of defaults and bankruptcies that needs to happen to shake out over-indebted, less efficient players has only just started.
SMU’s view is that the extraordinary changes presently taking place in the global energy markets have a large political component which could change overnight but, in the meantime, steel demand will be negatively impacted, as is already the case for OCTGs. The decline in global oil prices will reduce the incentive to invest in non-traditional exploration, which will close the supply/demand imbalance in the US and to a lesser extent globally. The market trends for natural gas, which are helped by its less severe carbon impact, will eventually result in higher prices and a virtuous spiral in production as supply stimulates demand from such industries as power generation, transportation and direct reduced iron among many others.