Market Data

January 22, 2015
SMU Steel Buyers Sentiment Index at +56
Written by John Packard
Buyers and sellers of flat rolled steel continue to be optimistic about their company’s chances of being successful in both the current market conditions as well as three to six months into the future. However, there have been some clouds building as our 3MMA has been trending lower over the past four months. We have also seen hot rolled prices decouple from our Sentiment Index. Steel Market Update measures optimism or pessimism in the steel industry based on the results of our twice monthly flat rolled steel survey. The results are reported twice monthly as our SMU Steel Buyers Sentiment Index.
SMU Steel Buyers Sentiment Index improved by 2 points this week compared to the beginning of the month of January and now stands at +56. The new reading is unchanged from one month ago and is an improvement over the mid-January reading of +44 recorded one year ago.
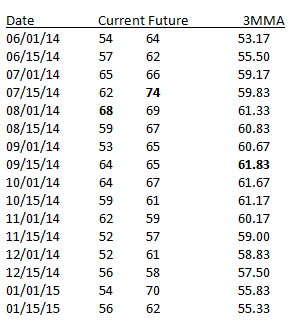
As was noted in our opening remarks, what concerns us is the trend of our three month moving average. The three month moving average (3MMA) for our current Sentiment Index is +55.33. The +55.33 is 0.50 points lower than at the beginning of January and 2.17 points lower than one month ago.
One year ago our 3MMA was +39.33 which means those involved in the flat rolled steel industry are much more optimistic than they were last year. Even with our three month moving average trending lower over the past few months.
The SMU Steel Buyers Future Sentiment Index was down from the early January report and is now being measured at +62, well within the optimistic range of our Index. The +62 is up 4 points from one month ago and it is 9 points better than one year ago.
During the survey process we provide our respondents the opportunity to leave comments behind explaining their position. We find these comments to be invaluable to understanding why the industry may be trending in one direction or another. This week’s survey was no exception.
A service center told us, “busy but with prices dropping there is no money to be made!”
A manufacturing company echoed the sentiments of the distributor above, “business is still improving, however over capacity exists and pricing is tough.”
Another manufacturing company associated with the construction industry told us, “While we’re still not seeing a broad surge across all our markets, several of our niche markets are more than strong enough to make up for that.” They went on to say, “We’re growing faster than we have for years.”
While a plate service center reported, “Plate business could use an uptick in activity. Our current inventory will support whatever is thrown at us for the foreseeable future – we are READY LOCKED and LOADED!” He went on to explain, “Good to Excellent IF (IF) the special projects cut loose as planned. RAIL – BRIDGE – OIL/GAS – WIND – Energy – Buildings – Etc, cut loose.”
A manufacturing company also involved in the construction business told us, “As long as the economy keeps chugging along, our business should do OK.”
A manufacture in Canada told us they were a little concerned, “we are in oil and gas country, so are bound to be affected by $50 oil and $3 nat gas.”
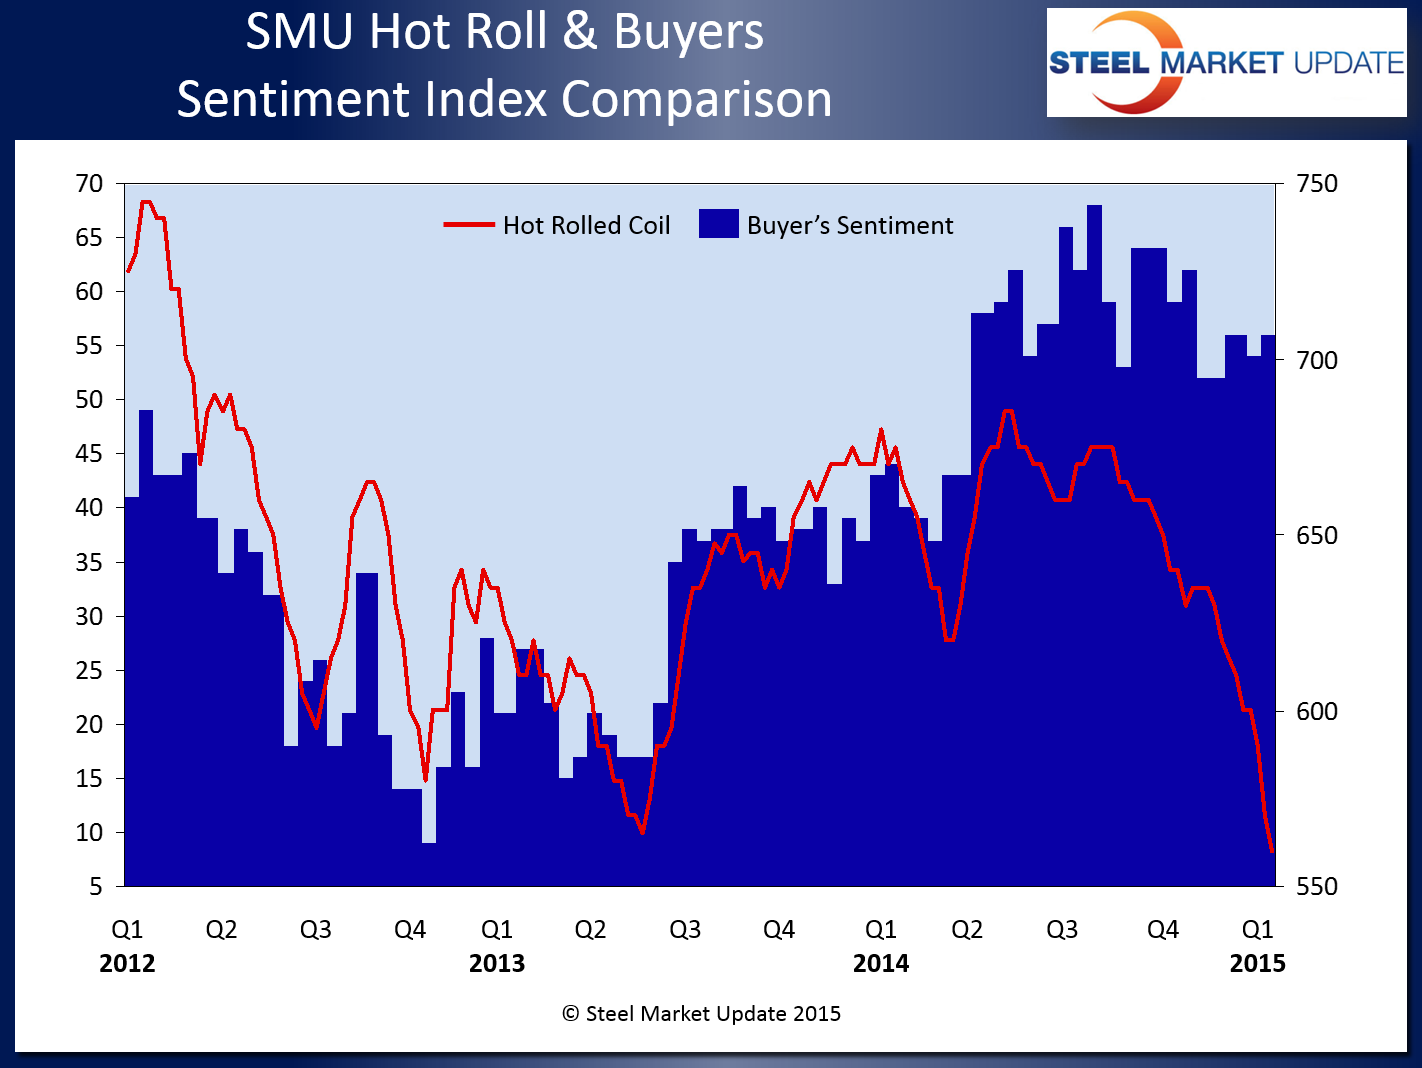
One of the questions we asked ourselves today as we produced this article on our Sentiment Index was, does Sentiment track the hot rolled price average?
As you can see by the graphic shown below, Sentiment and hot rolled coil prices appear to have a relatively tight relationship from the beginning of 2012 until the 4th Quarter 2014 when hot rolled prices began their accelerated decline. Our opinion at this moment is the pace has quickened due to the weakness in the energy markets caused by the drop in oil pricing in the world markets over the past few months. This has caused the pipe and tube producers associated with new drilling to reduce their orders and idle some of their facilities. At the same time other market segments have not yet been negatively impacted by oil’s demise. The automotive and construction markets continue to gain momentum with the expectation of another good year for light vehicle sales and production and, growth in the non-residential construction industry.

The trend for our 3MMA over the past four months has been moving lower or into less optimistic territory. We have not seen a negative mood in the flat rolled industry for some time and we need to be vigilant as we try to determine if Sentiment has reached at plateau and will move lower from here or is it just taking a breather before heading higher. Below is a table with the numbers over the past six months. You can clearly see the rise, peak and now decline in Sentiment utilizing our three month moving average…
About the SMU Steel Buyers Sentiment Index
SMU Steel Buyers Sentiment Index is a measurement of the current attitude of buyers and sellers of flat rolled steel products in North America regarding how they feel about their company’s opportunity for success in today’s market. It is a proprietary product developed by Steel Market Update for the North American steel industry.
Positive readings will run from +10 to +100 and the arrow will point to the right hand side of the meter located on the Home Page of our website indicating a positive or optimistic sentiment.
Negative readings will run from -10 to -100 and the arrow will point to the left hand side of the meter on our website indicating negative or pessimistic sentiment.
A reading of “0” (+/- 10) indicates a neutral sentiment (or slightly optimistic or pessimistic) which is most likely an indicator of a shift occurring in the marketplace.
Readings are developed through Steel Market Update market surveys which are conducted twice per month. We display the index reading on a meter on the Home Page of our website for our members to enjoy.
Currently, we send invitations to participate in our survey to almost 600 North American companies. Our normal response rate is approximately 110-170 companies. Of those responding to this week’s survey, 44 percent were manufacturing companies (same as our last survey) and 42 percent were service centers/distributors (up 1 percent from our last survey). The balance of the respondents are made up of steel mills, trading companies and toll processors involved in the steel business.


