Market Segment

January 21, 2015
Service Center Intake, Shipments and Inventory in December
Written by Peter Wright
Total service center carbon steel shipments in December increased by 16,900 tons to 2.996 million tons. This was mainly due to an increase in shipping days from 19 to 22. On a tons per day basis (t/d) shipments decreased from 156,800 to 136,200.
![]() In the eleven years 2004 through 2014 December shipments on average have been 14.7 percent less than November. This year December was down 13.1 percent from November, we can expect January shipments to be up by 16.4 percent when the data is released next month. Figure 1 demonstrates the seasonality of service center shipments and why comparing a month’s performance with the previous month is usually misleading. For this reason in the SMU analysis we always consider year over year changes.
In the eleven years 2004 through 2014 December shipments on average have been 14.7 percent less than November. This year December was down 13.1 percent from November, we can expect January shipments to be up by 16.4 percent when the data is released next month. Figure 1 demonstrates the seasonality of service center shipments and why comparing a month’s performance with the previous month is usually misleading. For this reason in the SMU analysis we always consider year over year changes.
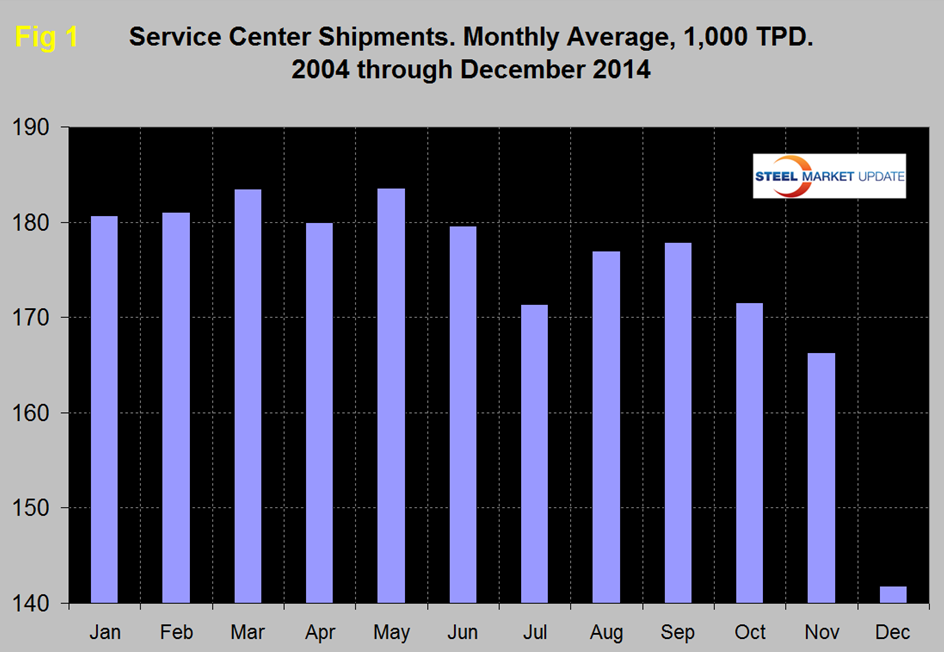
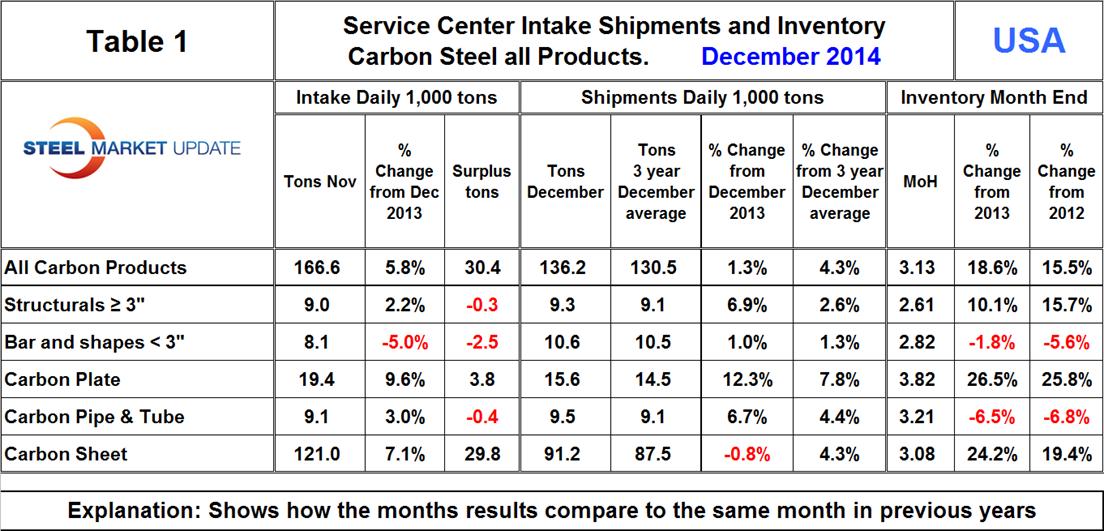
Table 1 shows the performance by product in December compared to the same month last year and also with the average t/d for December 2014, December 2013 and December 2012. We then calculate the percent change between December 2014, December 2013 and with the 3 year December average. We hope this give the best view of market direction. In December intake at 166,600 tons and exceeded shipments by 30,400 tons. Shipments of all products on a t/d basis were up by 1.3 percent from December last year and up by 4.3 percent from the average December shipments for 2014, 2013 and 2012. The fact that the single month growth comparison is lower than the three year comparison is an indication that momentum is negative and growth decelerated. This deceleration was almost entirely due to sheet products. Bars and light shapes has a slight negative momentum and plate and structurals advanced strongly. Pipe and tube had positive momentum, surprisingly given the state of the energy market.
Almost all of the intake surplus in December was sheet products. Plate had a small surplus of intake as all other product groups took in less than they shipped. Months on hand (MoH) in total increased from 2.92 at the end of November to 3.13 at the end of December. Figure 2 shows the MoH by product since January 2009, all products declined except sheet which increased strongly.
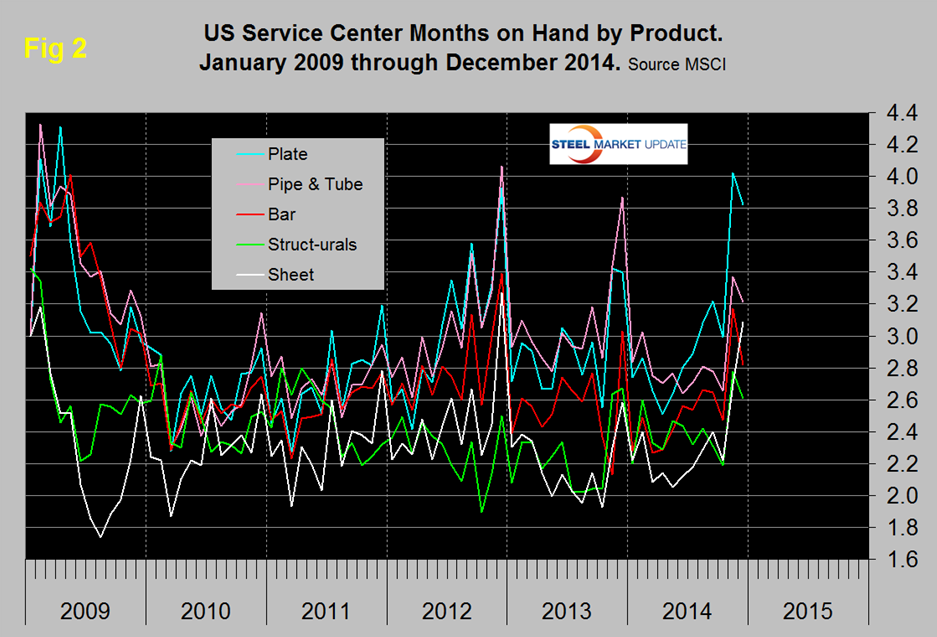
Figure 3 shows carbon steel plate shipments and the year over year growth of the three month moving average of those shipments since January 2000. Plate shipments have been growing between 8.3 percent and 11.2 percent in the last six months which is considerably better than all carbon steel shapes combined.
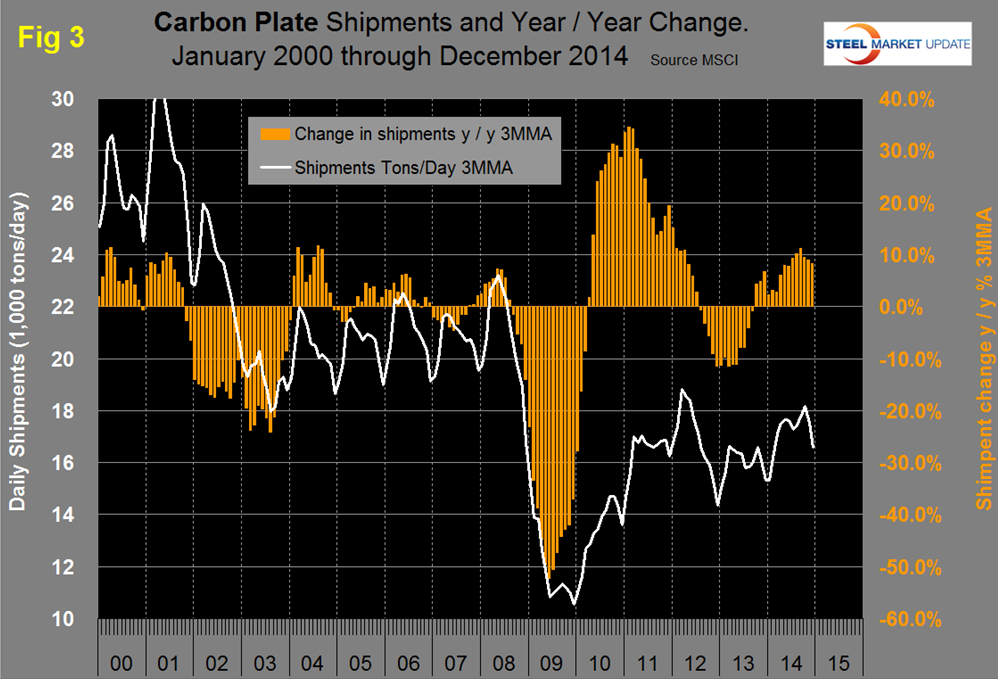
Figure 4 shows plate intake monthly since January 2004. Intake declined sharply in October and November but bounced back in December.
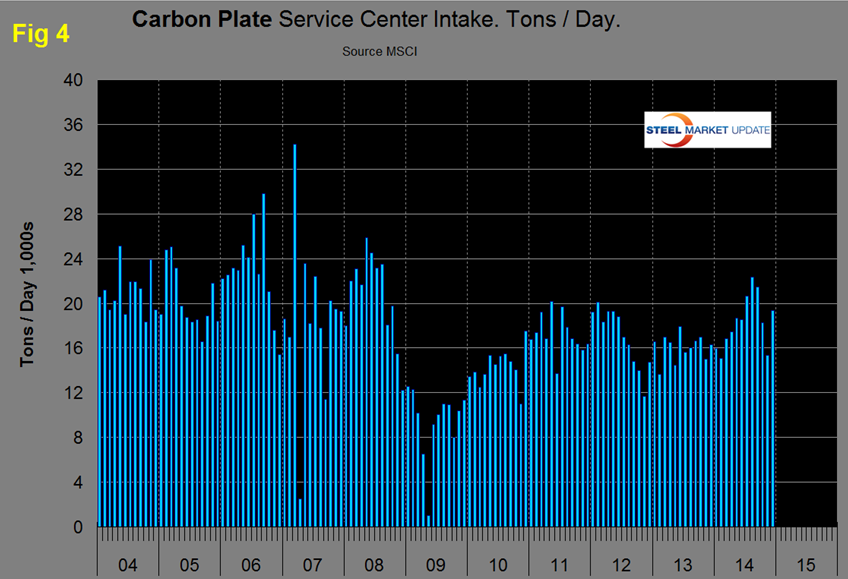
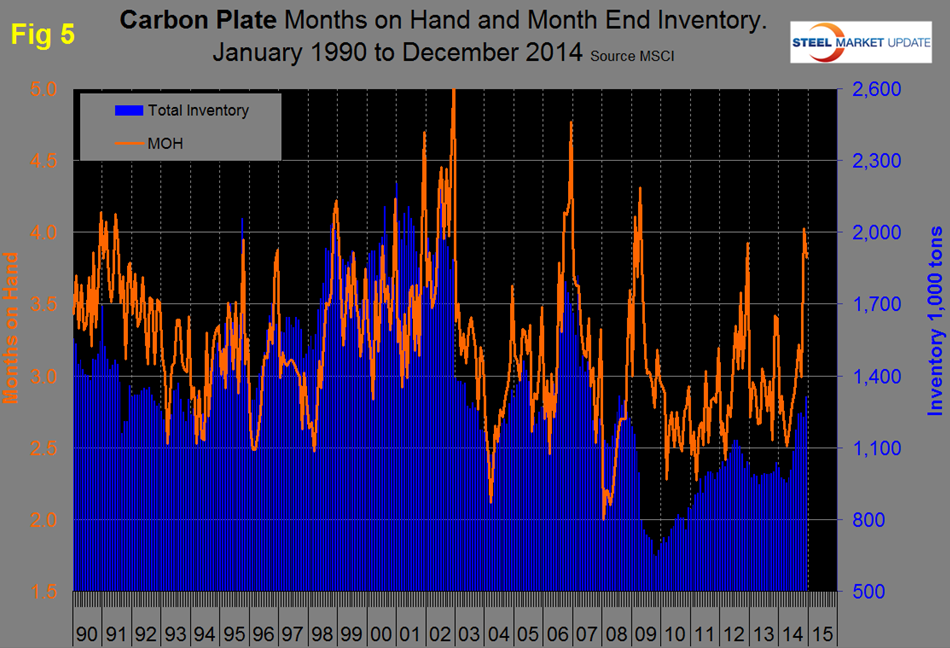
Figure 5 shows total inventory and MoH for plate since January 1990. There is always an end of year spike to MoH and 2014 was no exception.
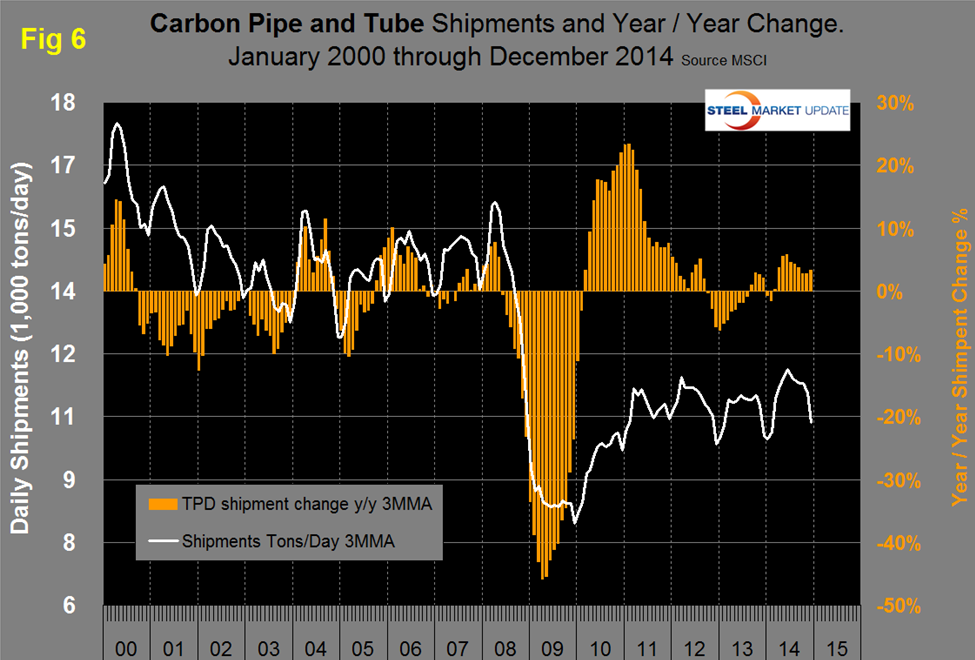
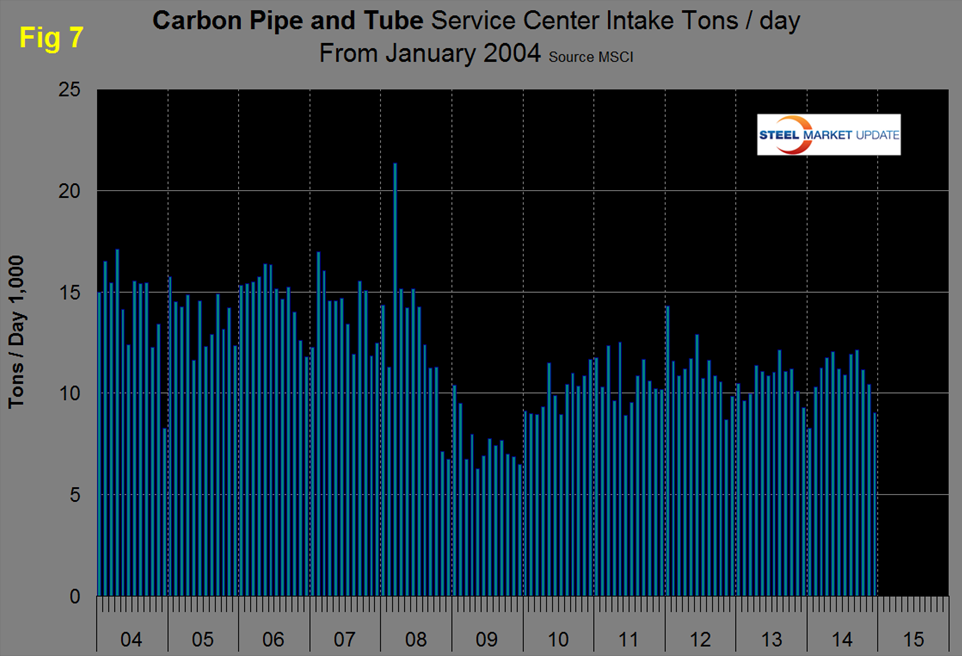
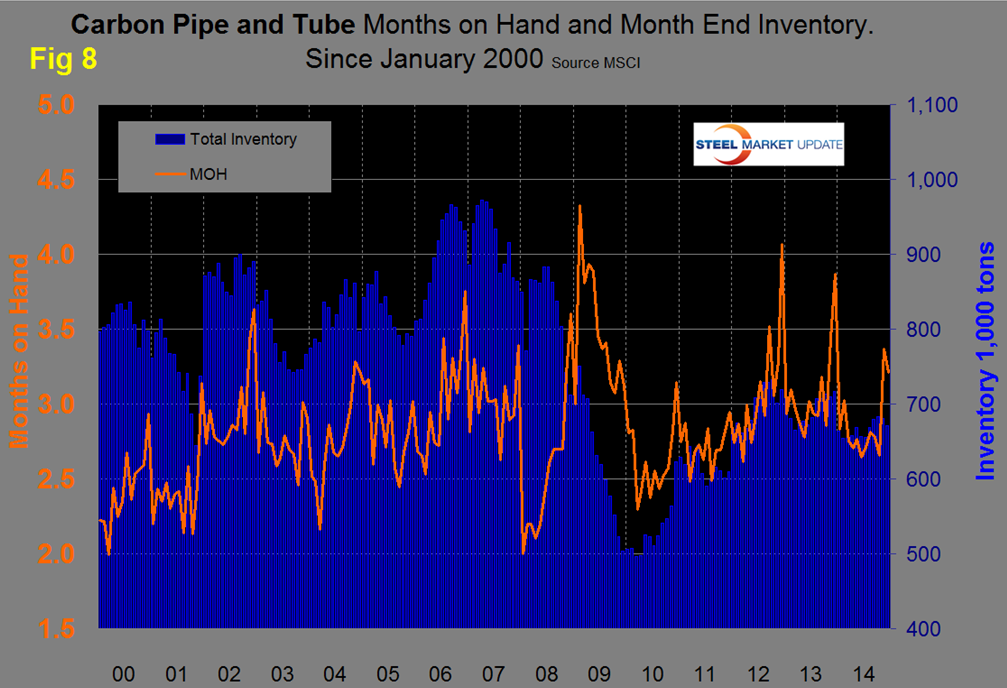
Figures 6, Figure 7 and Figure 8 show the same data for Pipe and Tube products. The growth of tubular shipments has been similar to that for total carbon products this year and considerably worse than for plate. Intake is also proportionately lower than plate. MoH of tubular goods did not spike in November to the same degree as plate but at year end was higher than all other carbon products.
The SMU data base contains many more product specific charts than can be shown in this brief review. Our intention is to enable our service center readers to compare their own results with these industry statistics and thus measure their own performance. For each product classified by the MSCI we have long term tonnage charts for shipments, intake, inventory and for months on hand. Readers are welcome to these on request.