Market Data

January 16, 2015
Industrial Production and Manufacturing Capacity Utilization
Written by Peter Wright
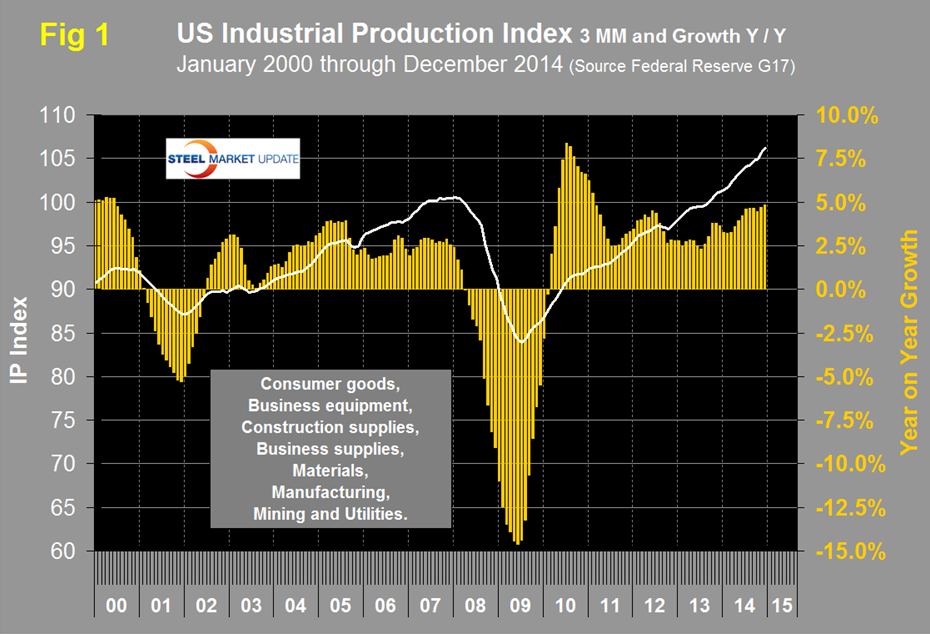
Both these data points are reported in the Federal Reserve G17 data base. The IP index was reported as 106.51 for December a decline of 0.1 percent from November. The three month moving average (3MMA) was 106.13 which was the highest value ever and the seventh straight month where the growth of the 3MMA exceeded 4 percent year over year. This was the highest growth in the 3MMA since February 2011 and was the fifteenth consecutive month for the index to exceed the pre-recession peak of September 2007. The 3MMA was up by 4.8 percent year over year in December. Data is seasonally adjusted and the index is based on the July 2007 level being defined as 100, (Figure 1).
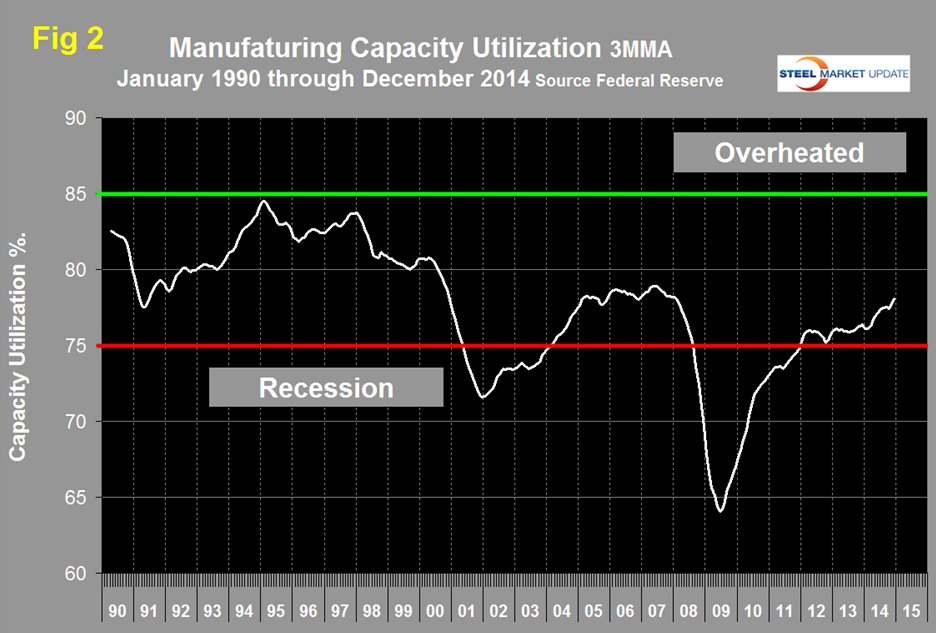
Manufacturing capacity utilization was 78.43 percent in December, this was only the second month to exceed 78 percent since December 2007. The 3MMA in December was 78.09 percent, up from 77.76 in November, (Figure 2). The 3MMA is now the highest since February 2008.
MAPI (The Manufacturers Alliance for Productivity and Innovation) presented the following observations on Thursday January 15th:
MAPI Foundation Business Outlook January 2015
The Composite Business Outlook Index edged down slightly from 67 in October to 66 in January. The index remains well above 50, the dividing line between expansion and contraction, and thus points to continued expansion over the next three to six months. The Federal Reserve’s industrial production index for the manufacturing sector tends to closely track the Composite Business Outlook Index. That is, a rise or fall in the composite index typically is followed by an even sharper rise or fall in the overall industrial production index for manufacturing. The MAPI indexes based on current business conditions were mixed in January. The Current Orders Index was 71, down from 78 in October. The Export Orders Index fell from 65 to 59 while the Backlog Orders Index slipped from 69 to 68. The Profit Margins Index increased from 67 in October to 70 and the Capacity Utilization Index jumped from 26.7 to 42.3, a level that is above its long-term average of 32.2 The Inventory Index decreased from 69 to 62 in January; this decrease is a positive sign in that it indicates that the danger of an inventory overbuilds has diminished.
The trends in the forward looking indexes were also mixed. The Prospective U.S. Shipments Index, based on expected shipments in the first quarter of 2015, declined from 83 in October to 77. This index is still at a very high level in absolute terms. The Non-U.S. Prospective Shipments Index fell from 72 to 58. The Annual Orders Index, based on a comparison of expected orders in 2015 with orders in 2014, slipped from 85 to 82, but remains strong. The U.S. Investment Index rose from 52 in October to 58, indicating that investment spending may pick up. The Non-U.S. Investment Index rebounded from 48 to a relatively strong 62 in January. Finally, the R&D Spending Index decreased from 70 to 67.
The results of the January survey point to continued expansion of manufacturing activity heading into 2015, but at a slightly slower pace than in the latter half of 2014. The individual indexes were mixed, with some declining from their October levels and others improving. Even those that declined, however, remain at relatively high levels. Further, the jump in capacity utilization may indicate a need for increased capital spending on plant and equipment.
The Federal Reserve Beige Book released on January 14th commented as follows on manufacturing activity. “Manufacturing activity expanded in most Districts. Philadelphia reported that manufacturing activity grew at a modest pace during the current reporting period, with a slight slowdown relative to the previous period. Reports regarding new orders and shipments in the Philadelphia District suggested some further slowing moving forward. Manufacturing shipments and new orders grew modestly in the Richmond District. Contacts at factories in the Cleveland District reported that demand increased a bit on balance. Manufacturing activity grew at a moderate pace in Boston, New York, Chicago, and San Francisco. However, a manufacturer in the Boston District indicated that congestion at West Coast ports had impeded its exports. Activity in the auto industry in the Chicago District remained a source of strength for the region. Atlanta reported that manufacturing activity strengthened overall. Minneapolis and Kansas City reported that manufacturing activity increased only slightly during the reporting period.
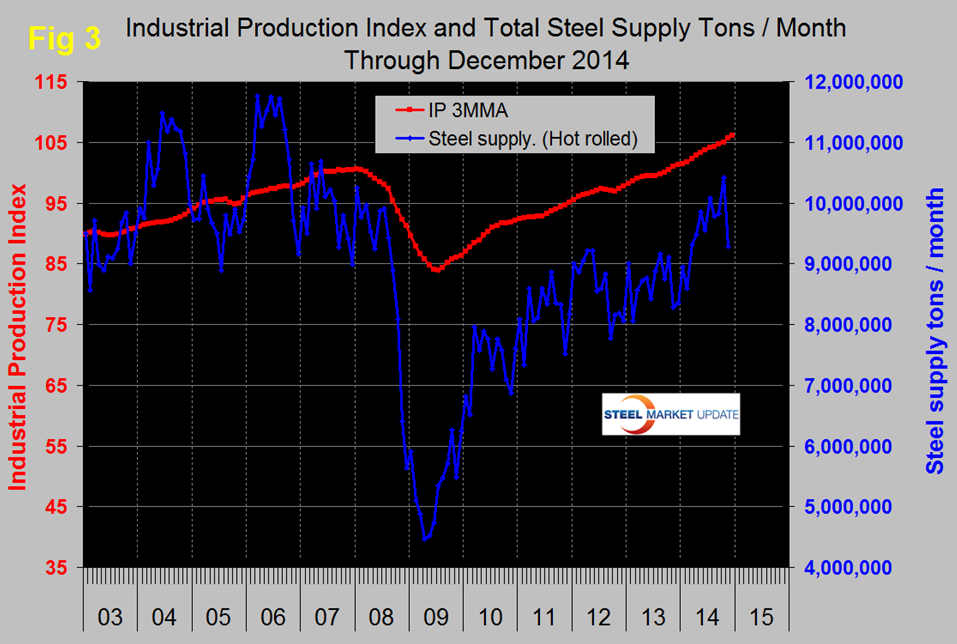
SMU Comment: We are very encouraged by the continued growth in industrial production. One cloud on the horizon is the increasing value of the US dollar compared to the currencies of our major trading partners which will eventually begin to eat into manufactured product exports. Prior to the recession there was a reasonable correlation between industrial production and steel supply though steel was very much more volatile in this comparison just as it is against GDP, (Figure 3). Steel supply took its seasonal dive in December. We have many indicators that suggest that steel supply is lower than it should be at this stage of a recovery but the gap between steel supply and the industrial production index is closing and based on current rates could converge sometime this year. Manufacturing is the growth engine of steel demand, housing and non-residential construction are still the drag and likely to be so for several years.


