

Prices

January 15, 2015
Oil and Gas Prices and Their Impact on Oil & Gas Rigs
Written by Peter Wright
Figure 1 shows historical gas and oil prices since January 2000. The daily spot price of West Texas Intermediate fell below $100 in August and by January 12th was down to $46.06, the latest daily figure available from the Energy Information Administration (EIA). Brent closed at $46.90 on the same day. There is no sign of a break in the catastrophic rate of decline. Natural gas delivered to the Henry Hub in Louisiana fell below $4.00 in August, there was an uptick in November but on January 9th was down to $3.06 per million BTUs.
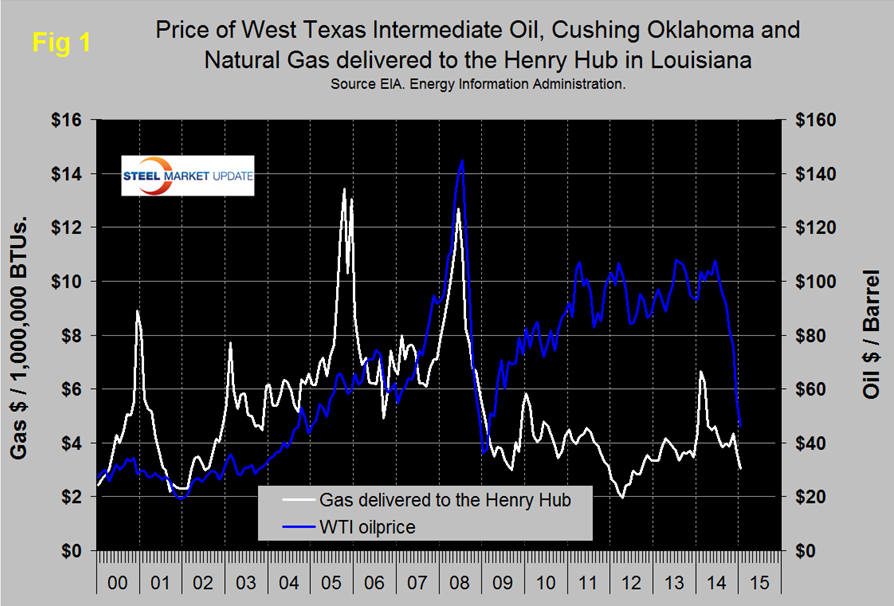
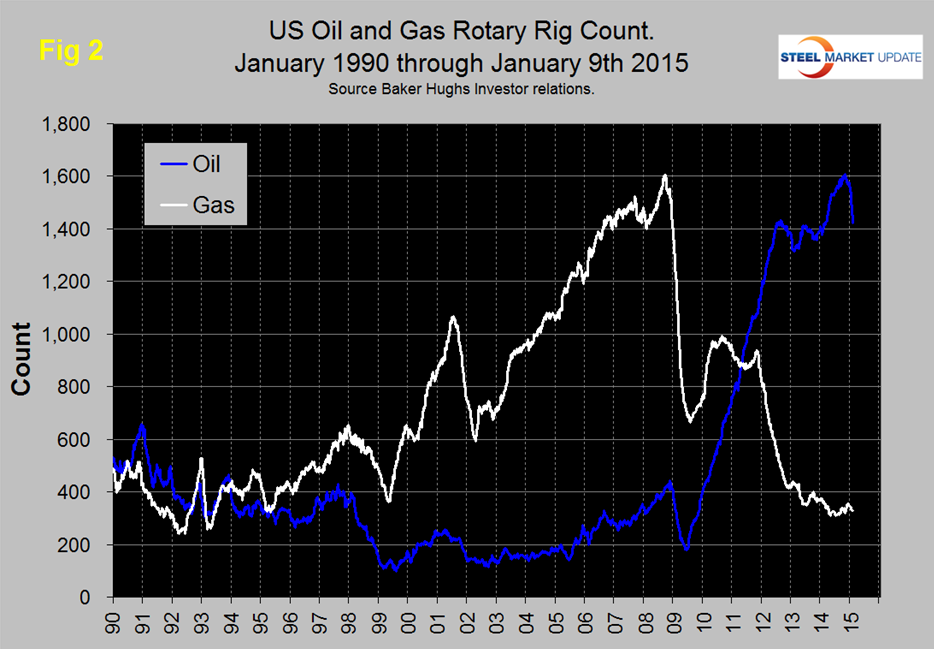
Figure 2 shows the Baker Hughes North American Rotary Rig Count which is a weekly census of the number of drilling rigs actively exploring for or developing oil or natural gas in the United States and Canada. Rigs are considered active from the time they break ground until the time they reach their target depth and may be establishing a new well or sidetracking an existing one. The Baker Hughes Rotary Rig count includes only those rigs that are significant consumers of oilfield services and supplies. Figure 2 shows that the oil rig count which had been trending flat for almost two years, accelerated in 2014 until October 10th when it reached 1,609 and has since responded to the collapsing oil price by declining to 1,421 on January 9th. The gas rig count has fallen by 28 from this time last year and now stands at 329 a level not seen since March 1995.
The total number of operating rigs is now 1,750 a decrease of 143 in the last month. Land rigs decreased by 137 to 1,696 and off shore by 6 to 54. On a regional basis the big three states for operating rigs are Texas at 810, down by 61 in the last month, Oklahoma at 206, down 5 and North Dakota at 162, down 17.
On January 14th the Energy Information Administration reported that market expectations of oil price uncertainty have increased in recent months. December was the sixth consecutive month in which monthly average Brent crude oil prices decreased, falling $17/barrel (bbl) from November to a monthly average of $62/bbl, the lowest since May 2009. The December price decline, and its continuation into early January, reflects continued growth in U.S. tight oil production, strong global supply, and weakening outlooks for the global economy and oil demand growth. As oil prices have sharply declined, market expectations of uncertainty in the price outlook have increased, as reflected in the current values of futures and options contracts. West Texas Intermediate (WTI) futures contracts for April 2015 delivery, traded during the five-day period ending January 8, averaged $51/bbl, with the value of options contracts establishing the lower and upper limits of the 95 percent confidence interval for the market’s expectations of monthly average WTI prices that month at $34/bbl and $76/bbl, respectively. The 95 percent confidence interval for market expectations widens considerably over time, with lower and upper limits of $28/bbl and $112/bbl for prices in December 2015. Volatility in front-month contracts also moved higher for both WTI and Brent in December and the first week of January, crossing the 50 percent level for the first time since August 2011. The growing uncertainty surrounding oil prices presents a major challenge to all price forecasts. EIA’s January Short-Term Energy Outlook, released yesterday, forecasts Brent crude oil prices averaging $58/bbl in 2015 and $75/bbl in 2016, with annual average WTI prices expected to be $3/bbl to $4/bbl below Brent. These price projections reflect a scenario in which supply is expected to continue to exceed demand, leading to inventory builds through the first three quarters of 2015. With increased demand and weakening supply, the market becomes more balanced beyond mid-2015, and prices are expected to begin to rise.
On January 5th Global Risk Insights published the following in Seeking Alpha. (Abridged by SMU).
Shale Oil Boom Uncertain In Wake of Falling Oil Prices
“No state in the U.S. has benefited more from the shale oil boom than North Dakota. Just as quickly as the transformation came, it could disappear with low oil prices. Since 2005, North Dakota’s oil production has expanded nine fold to make it the second largest oil-producing state in the U.S. This is all due to technological advances in hydraulic fracturing, or fracking. The fields and pastures that covered western North Dakota suddenly became known as the Bakken Oil Field. The impact of fracking on North Dakota’s economy has been well documented. The state’s population has grown more than 7 percent since 2010 and unemployment is 2.8 percent – both the best figures of any U.S. state. North Dakota’s economy has grown 168 percent since 2003, compared to 46 percent for the U.S. as a whole. The contribution from oil and gas skyrocketed more than twenty-seven times in the same period. The question the state faces now, when the price of oil has fallen 50 percent in just a few months, is what will happen to the industry in the future. Has the tremendous growth in production lowered prices too far for it to be profitable? To answer those questions, producers need to know whether they will be profitable and whether they will be able to secure the financing to drill new wells. Both carry a high level of uncertainty. Analysts have put together a wide range of estimates of “breakeven” points, the price below which producing oil is no longer profitable. For the Bakken range, the consensus is between $60 and $65, although one headline number cannot capture the complexity of assessing project viability.
“With oil prices sitting near those prices now, companies are becoming wary about drilling new wells. This poses two problems. First, consistent production in the Bakken Field requires consistently drilling new wells. Continental Resources, the largest producer in North Dakota, recently lowered its forecast of new Bakken wells in 2015 by 14 percent. All wells decrease in production over time, but fracking wells decrease much faster. The wealth from the region could quickly dry up without reinvestment. Second, it is almost useless to predict both oil prices and drilling costs. Who predicted that oil would fall so quickly? Fracking technology has been equally unpredictable in that it has progressed much faster than expected. Breakeven points were once thought to be between $80 and $100 for the Bakken Field, but multi-pad well technology has quickly lowered those estimates.
“Complicating the situation is OPEC, which in late November decided not to cut production. OPEC is no longer the well-oiled machine that brought the U.S. economy to its knees in the 1970s. Nonetheless, it has chosen to play a game that looks just like the basic game theory structure of the War of Attrition, which takes immense wherewithal to win from OPEC’s position, but can cause collateral damage to its members and US shale producers in the meantime. If oil prices remain near or below the breakeven point, the impact on the North Dakota economy could be catastrophic. It has put aside all other industries to fuel the surge of jobs and money flowing from the Bakken Oil Field, but it may not last. Tax revenues would dry up and new residents who came for oil jobs would be left looking. Approximately 10 percent of North Dakota jobs are in the oil industry.”
AMM reported on January 5th that distributor selling prices for OCTG reversed course in December after seven consecutive months of gains. The Pipe Logix sentiment index plunged in December from 54 to 34 after peaking at 74 just three months ago. This index was initiated in mid-2013. Several components of the index namely new orders, the price outlook and the overall supply/demand balance fell dramatically. As a result of declining demand US Steel announced that layoffs at its Lorain and Houston tubular facilities would be implemented in March.
SMU’s view is that the extraordinary changes presently taking place in the global energy markets will inevitably impact future steel demand. The decline in global oil prices will reduce the incentive to invest in non-traditional exploration and the market trends for natural gas will eventually result in higher prices and a virtuous spiral in production as supply stimulates demand from such industries as power generation and direct reduced iron among many others.


