Market Data

December 2, 2014
Manufacturing Slid Back Slightly in November
Written by Peter Wright
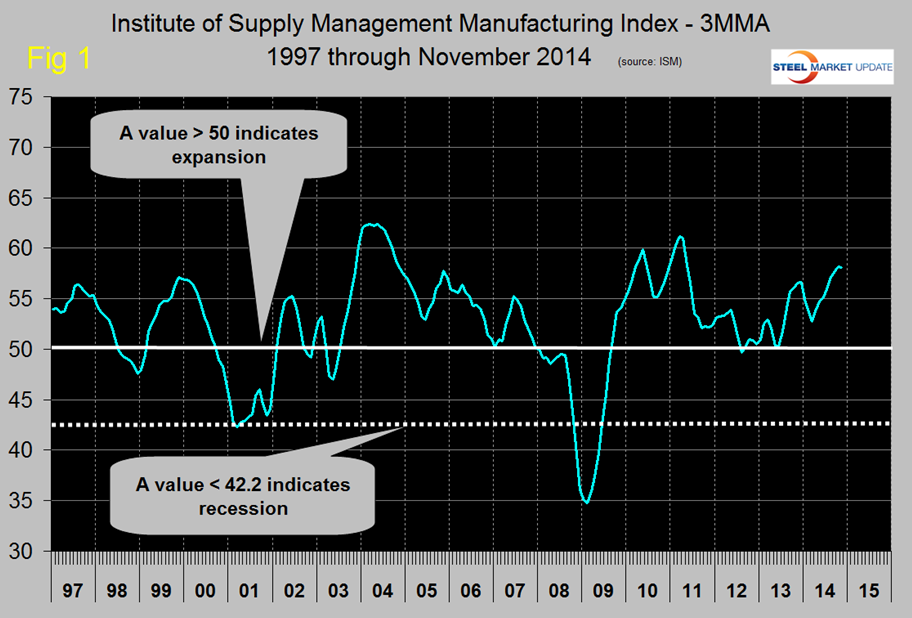
The Institute of Supply Management released their November report on December 2nd and after the October surprise on the upside, the index slid back slightly from 59.0 to 58.7. However, this is still the third best result of the year. Any number >50 indicates expansion and this was the eighteenth straight month for which this was the case. The three month moving average (3MMA) declined from 58.2 in October to 58.1 in November, this was the twenty sixth consecutive month of a value >50 in the 3MMA but was the first time in eight months that its average declined, (Figure 1).
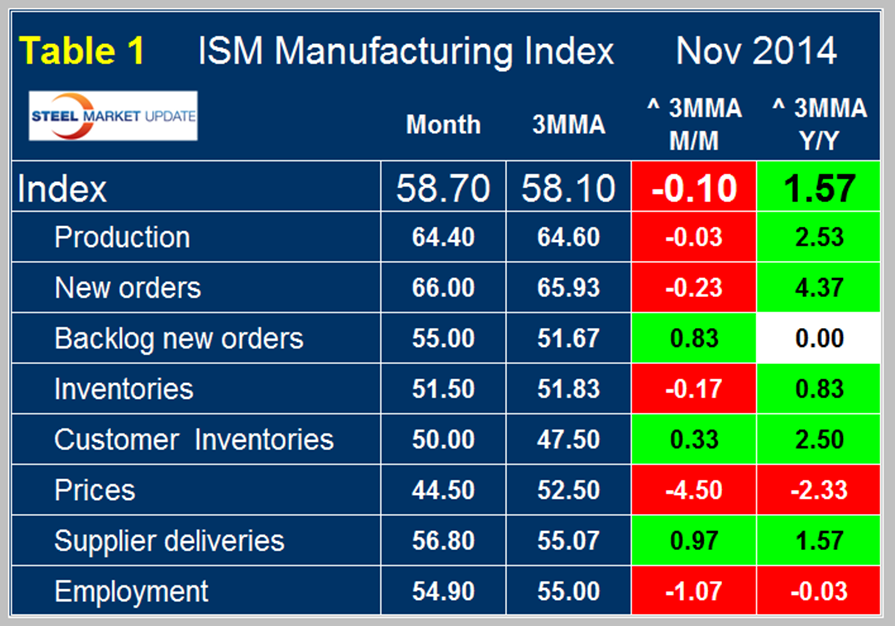
Table 1 shows the breakdown for November by sub component with the monthly result, the 3MMA, the growth of the 3MMA month over month and year over year for each. The detail is less encouraging than it has been any time since March with five sub-components contracting month over month and two contracting year over year. The index has exceeded or equaled 60 only 14 times in the 166 months since January 1997 which is as far back as our data goes so the November reading of 58.7 is still very strong.
The official news release reads as follows:
November 2014 Manufacturing ISM Report on Business – PMI at 58.7 percent
Economic activity in the manufacturing sector expanded in November for the 18th consecutive month, and the overall economy grew for the 66th consecutive month, say the nation’s supply executives in the latest Manufacturing ISM Report On Business.
The report was issued today by Bradley J. Holcomb, CPSM, CPSD, chair of the Institute for Supply Management (ISM) Manufacturing Business Survey Committee. “The November PMI registered 58.7 percent, a decrease of 0.3 percentage point from October’s reading of 59 percent, indicating continued expansion in manufacturing. The New Orders Index registered 66 percent, an increase of 0.2 percentage point from the reading of 65.8 percent in October. The Production Index registered 64.4 percent, 0.4 percentage point below the October reading of 64.8 percent. The Employment Index grew for the 17th consecutive month, registering 54.9 percent, a decrease of 0.6 percentage point below the October reading of 55.5 percent. Inventories of raw materials registered 51.5 percent, a decrease of 1 percentage point from the October reading of 52.5 percent. The Prices Index registered 44.5 percent, down 9 percentage points from the October reading of 53.5 percent, indicating lower raw materials prices in November relative to October. Comments from the panel are upbeat about strong demand and new orders, with some expressing concerns about West Coast port slowdowns and the threat of a potential dock strike.”
Of the 18 manufacturing industries, 14 are reporting growth in November in the following order: Food, Beverage & Tobacco Products; Miscellaneous Manufacturing; Furniture & Related Products; Fabricated Metal Products; Textile Mills; Printing & Related Support Activities; Electrical Equipment, Appliances & Components; Paper Products; Plastics & Rubber Products; Machinery; Transportation Equipment; Nonmetallic Mineral Products; Petroleum & Coal Products; and Primary Metals. The only industry reporting contraction in November is Apparel, Leather & Allied Products.
What Respondents are Saying…
– “The Holiday Season continues to exceed expectations. Customers are generally optimistic for future sales growth.” (Food, Beverage & Tobacco Products)
– “Continued strong demand. Deliveries through the West Coast are delayed due to a number of factors.” (Fabricated Metal Products)
– “We have seen continued growth in transportation equipment. Slowdowns and threats of strike of West Coast longshoreman weigh heavily on U.S. operations.” (Transportation Equipment)
– “Business continues to be stronger than last year.” (Furniture & Related Products)
– “Improvement in defense spending and manufacturing.” (Computer & Electronic Products)
– “West Coast port longshoreman slowdown is affecting business with longer lead times.” (Chemical Products)
– “We continue to hire people. People are also leaving to take other jobs indicating the job market is starting to improve for manufacturing.” (Electrical Equipment, Appliances & Components)
– “Market has remained strong going into year-end.” (Wood Products)
– “Order intake has been substantial, resulting in a very healthy backlog. The packaging automation requirements in the food and beverage market are robust.” (Machinery)
– “Demand remains strong for new orders.” (Miscellaneous Manufacturing)
Explanation: The Manufacturing ISM Report on Business is published monthly by the Institute for Supply Management, the first supply institute in the world. Founded in 1915, ISM exists to lead and serve the supply management profession and is a highly influential and respected association in the global marketplace. ISM’s mission is to enhance the value and performance of procurement and supply chain management practitioners and their organizations worldwide. This report has been issued by the association since 1931, except for a four-year interruption during World War II. The report is based on data compiled from purchasing and supply executives nationwide. Membership of the Manufacturing Business Survey Committee is diversified by NAICS, based on each industry’s contribution to gross domestic product (GDP). The PMI is a diffusion index. Diffusion indexes have the properties of leading indicators and are convenient summary measures showing the prevailing direction of change and the scope of change. A PMI reading above 50 percent indicates that the manufacturing economy is generally expanding; below 50 percent indicates that it is generally declining. A PMI in excess of 42.2 percent, over a period of time, indicates that the overall economy, or gross domestic product (GDP), is generally expanding; below 42.2 percent, it is generally declining. The distance from 50 percent or 42.2 percent is indicative of the strength of the expansion or decline. With some of the indicators within this report, ISM has indicated the departure point between expansion and decline of comparable government series, as determined by regression analysis.


