Prices

November 19, 2014
Global Steel Production and Capacity Utilization
Written by Peter Wright
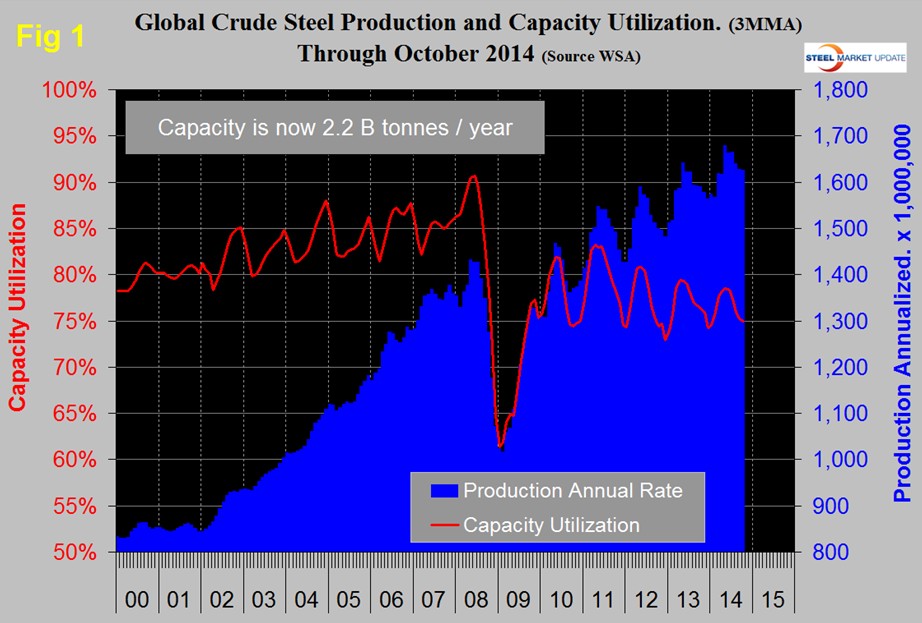
Production in October on a tons per day basis was 4.411 million tons, down from 4.485 in September. This was the fourth month since February when production was <4.5 million metric tons per day. October had one more production day than September and the month’s total increased from 134.562 million to 136.838. Since January 2008 on average, October monthly production has increased by 0.66 percent, this year October increased by 1.62 percent from September. The three month moving average (3MMA) of production in October on an annualized basis was 1.626 billion tons and a capacity utilization of 74.7 percent, (Figure 1). Capacity is now 2.2 billion tons. Since 2010 production has progressively increased and capacity utilization has decreased. The gap is widening. Sooner or later there has to be a correction which will probably be a major slowdown in capacity construction in China, if not an actual Chinese capacity decrease.
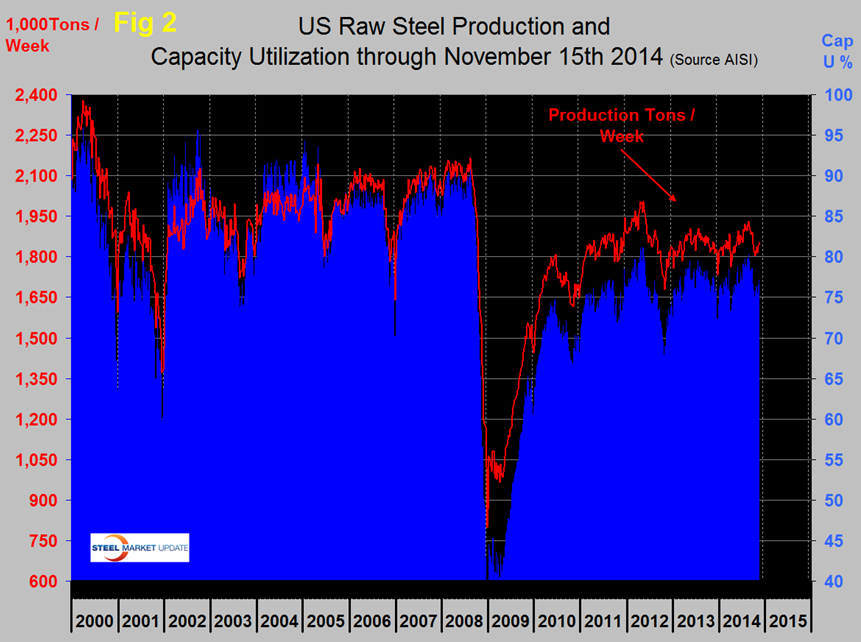
We thought it would be interesting this month to compare the same data for the US which is shown in Figure 2. This is weekly data and not smoothed so the graph is much spikier but the situation is clear. Production and capacity utilization have remained in balance though neither has made much progress since 2011.
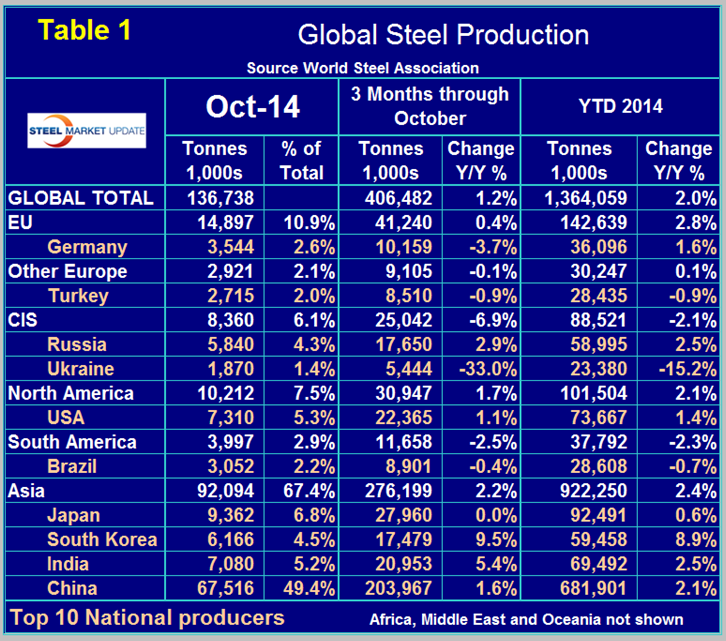
Table 1 shows regional global production in the single month of October with regional share of the global total, also three months production through October and YTD production. Regions are shown in white font and individual nations in beige.
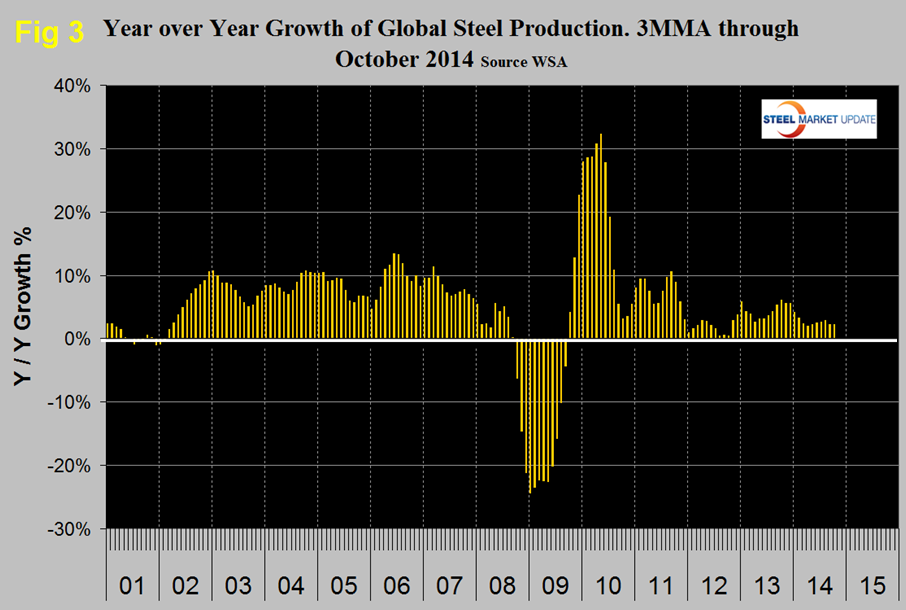
In three months through October y/y global growth was 1.2 percent. Year to date growth through October was 2.0 percent, since the 3 month growth is less than the 10 month YTD growth, it means that production is slowing. This is not a seasonal effect as our comparison is year over year. Asia continued to be the growth engine in three months through October led by South Korea with a 9.5 percent growth rate. China’s growth was 1.6 percent and Japan zero. China’s growth rate appears to be slowing but as a result of lower domestic demand their exports are now at an all-time high. The CIS, other Europe and South America had negative y/y growth in three months through October. The effect of the war in Ukraine is clear in the contraction of that country’s steel production. The European Union which had the fastest growth rate in early 2014 continued to slow and achieved only 0.4 percent in three months through October, Germany contracted by 3.7 percent. Year over year growth of output in the NAFTA was 1.7 percent in three months through October with the US at 1.1 percent. Canada achieved 8.0 percent and Mexico 0.9 percent. South America had negative 2.5 percent growth through October with its largest producer, Brazil down by 0.4 percent. In October China’s share of total global production dropped below 50 percent to 49.4 percent and North America’s was 7.5 percent. Figure 3 shows that the 3MMA of the y/y growth of global production which steadily increased from 2.0 percent in April to 2.8 percent in August, fell to 2.2 percent in September and stayed at 2.2 percent in October.


