Market Data

November 12, 2014
Net Job Creation through October 2014
Written by Peter Wright
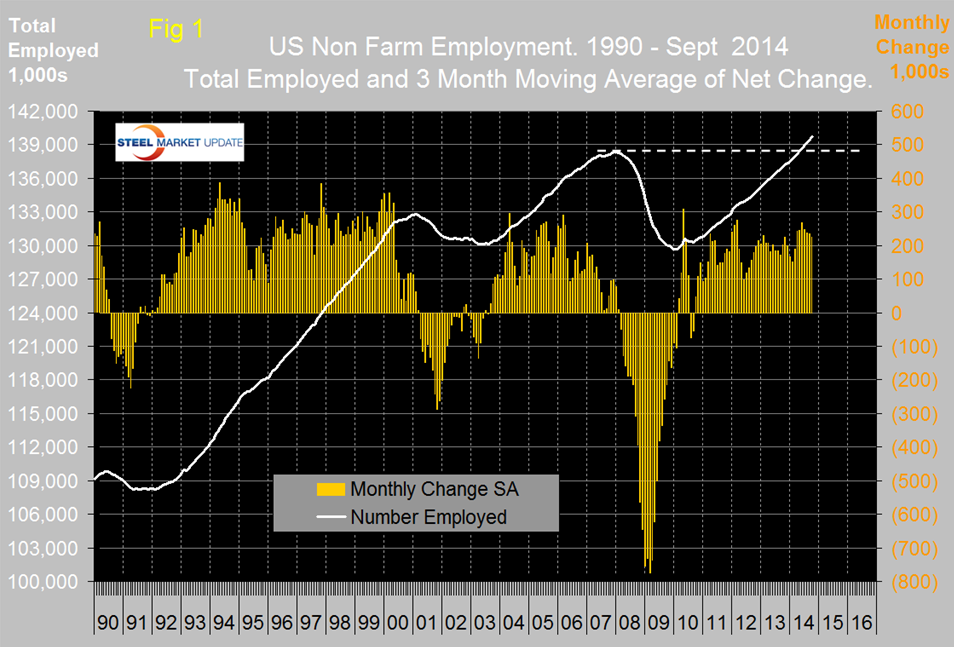
The Bureau of Labor Statistics (BLS) report on non-farm employment indicated that 214,000 jobs were added in October, September and August were revised up by 8,000 and 23,000 respectively. The three month moving average, (3MMA) has declined for four straight months but this job recovery is stronger than was the case in the mid-2000s, (Figure 1).
Total non-farm payrolls are now 1,135,000 more than they were at the pre-recession high of January 2008. In each of the last seven months the 3MMA has exceeded 200,000 / month and in the first ten months of 2014 has averaged 220,000. All numbers in this analysis are seasonally adjusted by the BLS. The total number employed in the US is now 139,680,000 people.
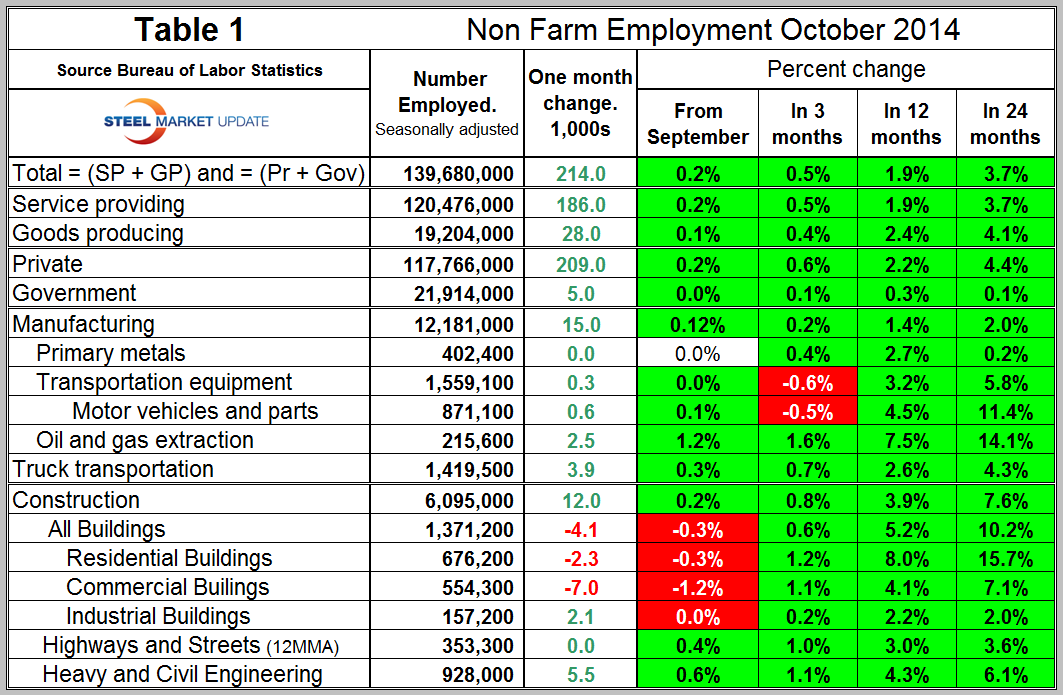
Table 1 slices total employment into service and goods producing industries and then into private and government employees. Total employment equals the sum of private and government employees. It also equals the sum of goods producing and service employees. Most of the goods producing employees work in manufacturing and construction and these sectors are further subdivided in Table 1. In October private employment grew by 209,000 and government by 5,000. Service industries expanded by 186,000 and goods producing by 28,000 people. Private sector employment has expanded by 4.4 percent in the last 24 months as government by 0.1 percent. Government employment contracted from September 2009 through January this year but has now had nine straight months of growth. All the growth in government employment has been at the local level. In the first ten months of 2014, the federal government has shed 25,000 jobs, state governments have added 2,000 and local governments have added 83,000 positions. This is a recovery process, during the recession most of the government losses were at the local level.
Manufacturing has added 128,000 jobs this year with 15,000 of those added in October. Truck transportation and oil and gas extraction were the strongest sectors with additions of 3,900 and 2,500 positions respectively. Note that Table 1 only identifies the major sectors in manufacturing and construction so the totals don’t add up.
Construction has added 219,000 jobs this year with 12,000 in October however the construction of buildings lost 4,100 jobs in October. The strongest construction sector in October was heavy and civil engineering which added 5,500 positions. Construction employment expanded in 236 metro areas, declined in 53 and was stagnant in 50 between September 2013 and September 2014, according to a new analysis of federal employment data released by the Associated General Contractors of America. Association officials said that as firms expand their payrolls, many are finding a limited supply of available qualified workers. “It is good news that construction employment gains have spread to more than two-thirds of the nation’s metro areas,” said Ken Simonson, chief economist for the association. “But there is a growing risk that contractors in many of these regions will have trouble finding qualified workers to complete the rising volume of projects.”
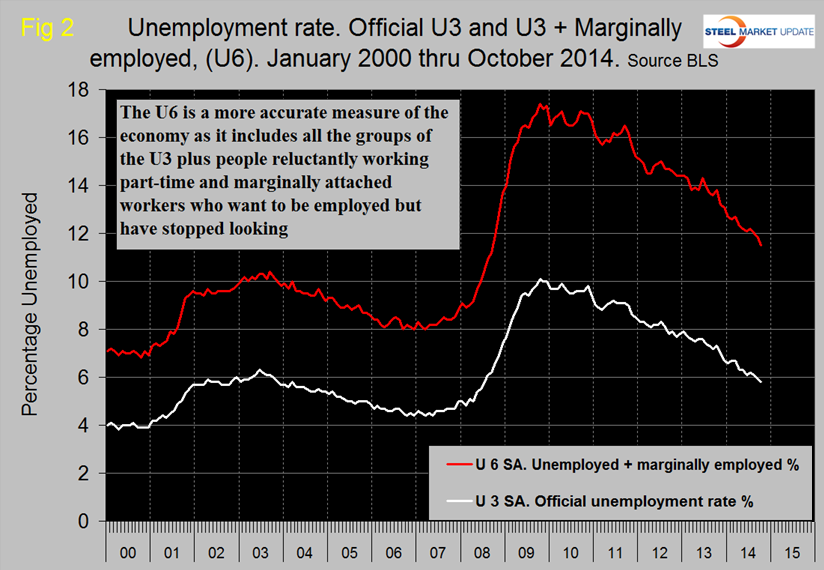
The official unemployment rate fell to 5.8 percent in October from 5.9 percent in September and 6.1 percent in August. This is known as the “U3” rate. The more comprehensive U6 unemployment rate stands at 11.5 percent, down from 11.8 percent in September and 12.0 percent in August, (Figure 2). U6 includes workers working part time who desire full time work and people who want to work but are so discouraged that they have stopped looking. The differential between these rates was usually less than 4 percent before the recession but in 2014 has averaged 5.9 percent. The good news is that the gap is closing.
The global outplacement consultancy Challenger, Gray & Christmas, Inc. issued the following press release on Thursday. At SMU we see relevance in this report as a reality check on other data sources that we use to evaluate the direction and velocity of employment change.
“Just one month after falling to a 14-year low, monthly job cuts surged nearly 70 percent in October to the second highest total this year, according to the report Thursday from global outplacement consultancy Challenger, Gray & Christmas, Inc.
U.S.-based employers announced 51,183 job cuts last month, a 68-percent increase from September’s 30,477, which was the lowest monthly total since June, 2000 (17,241). October job cuts were 12 percent higher than the 45,730 layoffs announced during the same month a year ago.
The October total is not only the second highest of the year behind May’s 52,961, but it marks only the fourth time in the last 22 months that job cuts exceeded 50,000.
Employers have now announced 414,591 job cuts so far this year. That is 4.3 percent fewer than last year, when 433,114 job cuts were reported from January through October.
“While it is too early to say for certain, the October figure may mark the kick-off to a fourth-quarter surge in job cuts. It is not unusual to see the pace of downsizing accelerate in the final months of the year, as employers take measures to meet year-end earnings and profit goals,” said John A. Challenger, chief executive officer of Challenger, Gray & Christmas.
“In recent years, since the end of the recession, the fourth quarter surge in job cuts has been somewhat subdued, with much of the increase occurring in October and November. In fact, in the previous two years, December was one of the lowest job-cut months.”
October job cuts were led by the retail industry, which announced 6,874 planned layoffs during the month. That is nearly 3.5 times more than the 1,965 job cuts announced by retailers in September. To date, these employers have now announced 38,948 in 2014, second only to the computer industry.
Computer firms announced another 6,509 job cuts in October. That brings the year-to-date total for the industry to 55,511, making it the leading job-cut industry by a wide margin.
“If there is any good news in the October job-cut surge, it is that the leading job cuts are not indicative of overall weakness in the economy. The heaviest cuts came from companies that are struggling to find their footing in this recovery. In several cases, downsizing organizations are in industries that are going through fundamental changes and these companies are taking steps to catch up to these changes,” said Challenger.
“For example, Sears, which announced the closure of 77 Sears and Kmart stores, has been struggling for years to find its niche in an increasingly competitive retail space. The challenges facing the one-time leader in the retail space have gotten progressively worse as more and more consumers take their shopping online.
“Meanwhile, Hewlett-Packard, which announced it is increasing previously announced workforce reductions by another 5,000, is another company trying to catch up in an ever-changing, but still robust and competitive technology sector. Likewise, wireless service provider Sprint has undergone large-scale job cuts since the beginning of the year in an effort to better compete in its fiercely competitive sector,” said Challenger.”
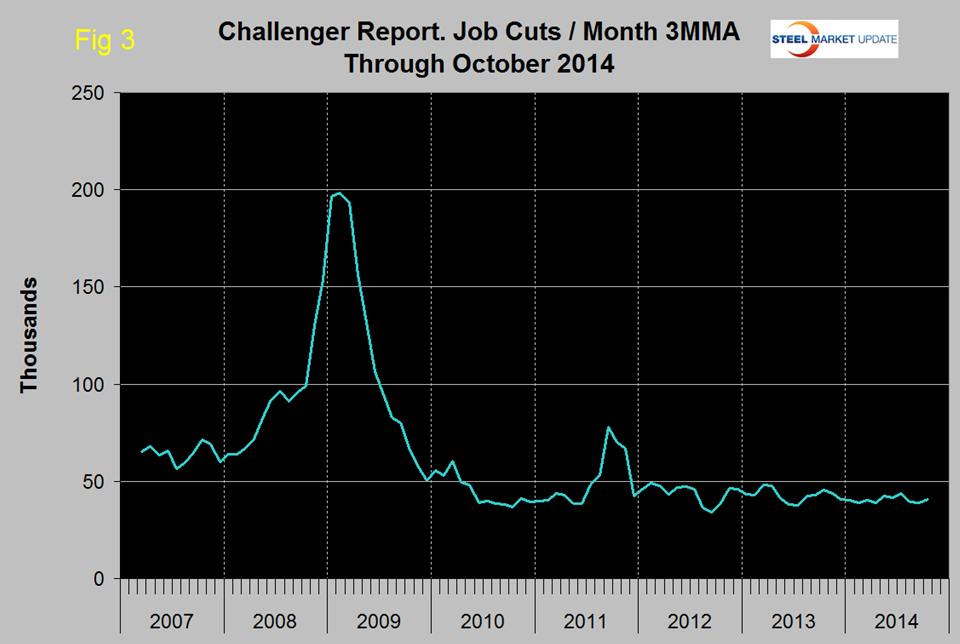
This rather pessimistic report is alleviated somewhat by the fact that the high October result case on the back of a very low figure for September. The SMU analysis of the 3MMA of job cuts provides a more realistic picture, (Figure 3).
On Friday the BLS issued the following press release:
Total non-farm payroll employment increased by 214,000 in October, in line with the average monthly gain of 222,000 over the prior 12 months. The unemployment rate edged down to 5.8 percent.
Food services and drinking places added 42,000 jobs in October, compared with an average gain of 26,000 jobs per month over the prior 12 months.
Employment in retail trade rose by 27,000 in October. Within the industry, employment grew in general merchandise stores (+12,000) and automobile dealers (+4,000). Retail trade has added 249,000 jobs over the past year.
Health care added 25,000 jobs in October, about in line with the prior 12-month average gain of 21,000 jobs per month. In October, employment rose in ambulatory health care services (+19,000).
Employment in professional and business services continued to trend up over the month (+37,000). Over the prior 12 months, job gains averaged 56,000 per month. In October, employment continued to trend up in temporary help services (+15,000) and in computer systems design and related services (+7,000).
In October, manufacturing employment continued on an upward trend (+15,000).
Within the industry, job gains occurred in machinery (+5,000), furniture and related products (+4,000), and semiconductors and electronic components (+2,000). Over the year, manufacturing has added 170,000 jobs, largely in durable goods.
Employment also continued to trend up in transportation and warehousing (+13,000) and construction (+12,000).
Employment in other major industries, including mining and logging, wholesale trade, information, financial activities, and government, showed little change over the month.
In October, the average workweek for all employees on private non-farm payrolls edged up by 0.1 hour to 34.6 hours. The manufacturing workweek was unchanged at 40.8 hours, and factory overtime edged down by 0.1 hour to 3.4 hours. The average workweek for production and non-supervisory employees on private non-farm payrolls edged up by 0.1 hour to 33.8 hours.
Average hourly earnings for all employees on private non-farm payrolls rose by 3 cents to $24.57 in October. Over the year, average hourly earnings have risen by 2.0 percent. In October, average hourly earnings of private-sector production and non-supervisory employees increased by 4 cents to $20.70.
The change in total non-farm payroll employment for August was revised from +180,000 to +203,000, and the change for September was revised from +248,000 to +256,000. With these revisions, employment gains in August and September combined were 31,000 more than previously reported.
SMU Comment: The October employment report suggests a slowing of job gains but is still tracking better than the recovery from the 2001 recession. Which of course it should be since the recessionary losses were much greater in 2008 and 2009.


