

Market Data

November 2, 2014
Job Growth Led by South Central Region of USA
Written by Peter Wright
The states compile their employment numbers independently of the Feds then both are reported by the Bureau of Labor Statistics. The results are close with the Feds reporting total job creation in Q3 of 671,000 and the states reporting 661,200. All regions had solid job creation in the 3rd Q led by the South Central with 138,800 new positions, (Table 1).
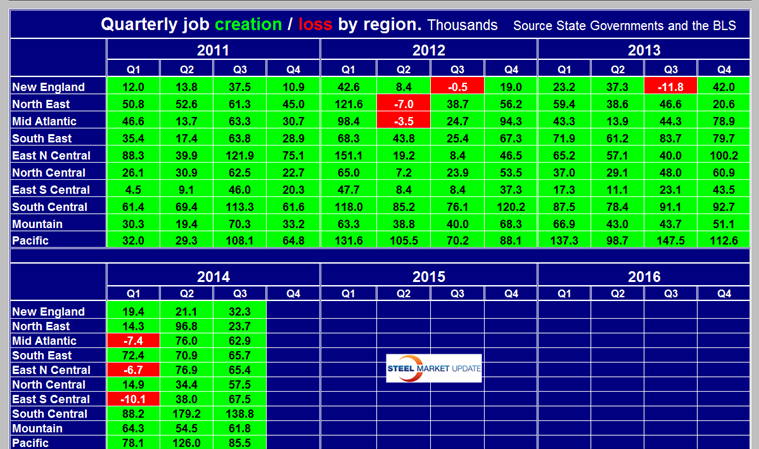
Of the total jobs created in the South Central, Texas contributed 111,000. The regions have fared very differently since the pre-recession high of 1st Q 2008 and since the low point of 4th Q 2009. There are now 1,440,000 more people employed than there were immediately before the recession but of that number 1,201,000 jobs were created in the South Central, (Texas, Louisiana, Oklahoma and Arkansas). All other regions in total contributed 239,000 ranging from the Pacific, (California, Oregon and Washington) with positive 233,000 to the East North Central, (Illinois, Indiana, Michigan, Ohio and Wisconsin) with negative 283,000 jobs. Employment is now 9,870,000 positions higher than it was at the low point of the recession, (Table 2).
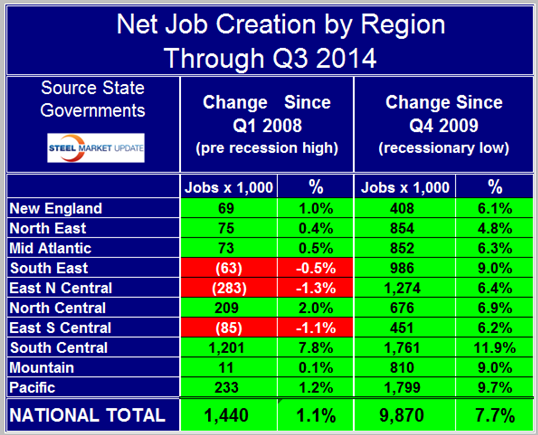
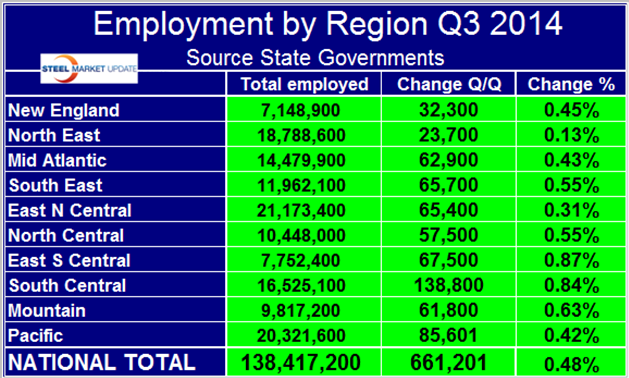
The Pacific has had the largest number of jobs created in that time period with 1,799,000 new or recovered positions which amounts to 9.7% of total employment. On a percentage basis the South Central leads with an employment increase of 11.9% and the North East, (New York, New Jersey and Pennsylvania) lags with 4.8%. The East North Central has the highest number of employed people with 21,173,400, followed by the Pacific with 20,321,600, (Table 3).
Written by: Peter Wright, CEO Steel Market Analysis and contributing writer and Steel 101 instructor for Steel Market Update.


