Market Data

October 14, 2014
Global Economic Outlook
Written by Peter Wright
The International Monetary Fund (IMF) made the following statement this week: “Despite setbacks, an uneven global recovery continues. Largely due to weaker-than-expected global activity in the first half of 2014, the growth forecast for the world economy has been revised downward to 3.3 percent for this year, 0.4 percentage point lower than in the April 2014 World Economic Outlook (WEO). The global growth projection for 2015 was lowered to 3.8 percent. Downside risks have increased since the spring. Short term risks include a worsening of geopolitical tensions and a reversal of recent risk spread and volatility compression in financial markets. Medium-term risks include stagnation and low potential growth in advanced economies and a decline in potential growth in emerging markets. Given these increased risks, raising actual and potential growth must remain a priority. In advanced economies, this will require continued support from monetary policy and fiscal adjustment attuned in pace and composition to supporting both the recovery and long term growth. In a number of economies, an increase in public infrastructure investment can also provide support to demand in the short term and help boost potential output in the medium term. In emerging markets, the scope for macroeconomic policies to support growth if needed varies across countries and regions, but space is limited in countries with external vulnerabilities. And in advanced economies as well as emerging market and developing economies, there is a general, urgent need for structural reforms to strengthen growth potential or make growth more sustainable.”
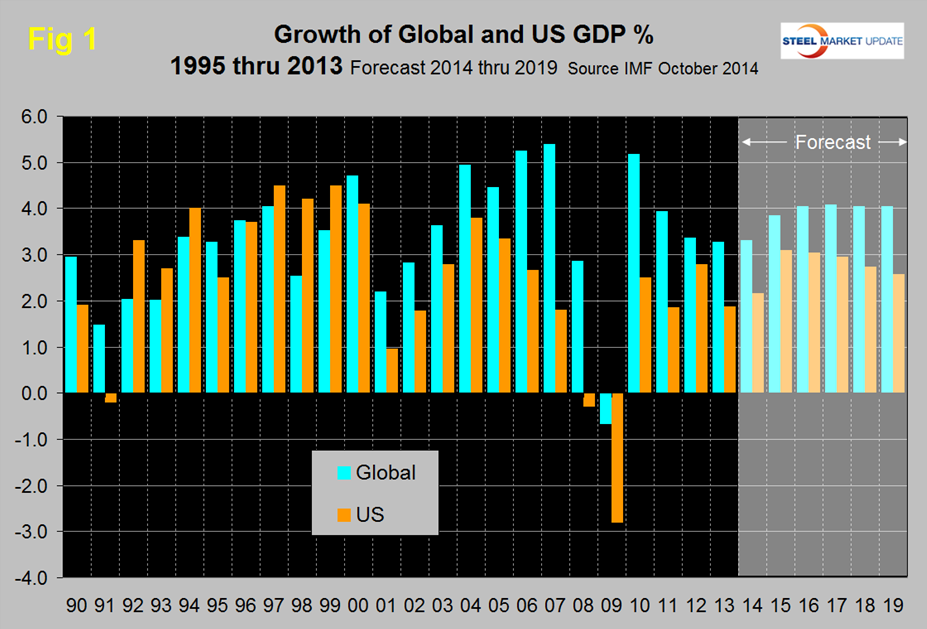
Prior to the 2001 recession, the US held its own in the economic growth stakes, but between 2001 and 2008, growth in the US averaged 1.84 percent less per year than the growth of the global economy as a whole, (Figure 1).
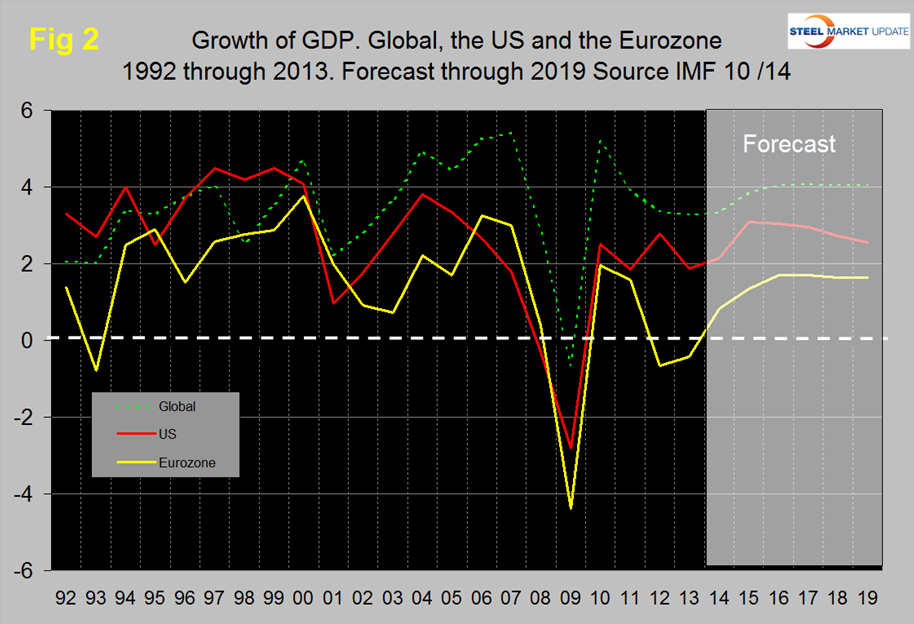
In the years 2011 through 2013, that gap narrowed to 1.36 percent. Global growth is now forecast to level off at about 4 percent in the years 2016 through 2019; the discrepancy with the US widening again. The US has outperformed the Eurozone in every year since 2008 and is forecast to continue to do so through 2019, (Figure 2).
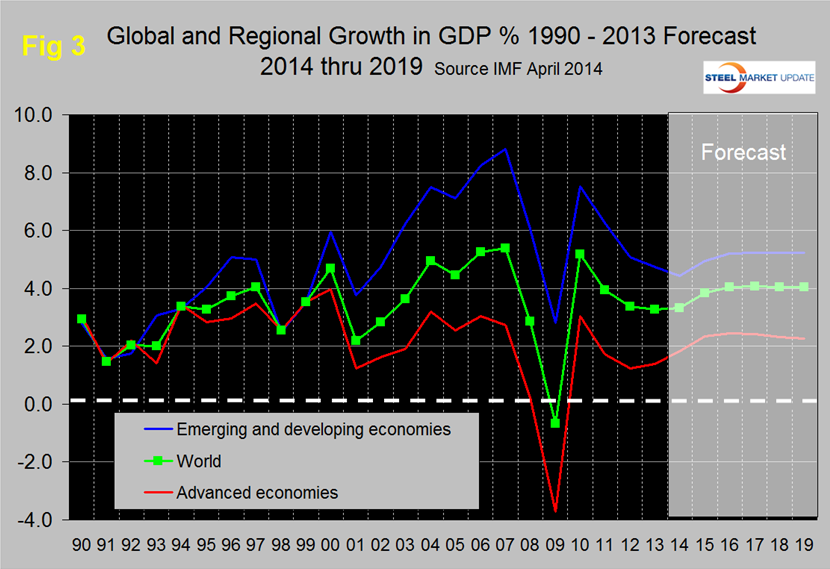
Figure 3 shows the growth comparison between emerging and developing economies and the advanced economies, that gap is projected to widen in the tail end of this decade.
Within NAFTA, Mexico is forecast to maintain a growth rate of about 3.8 percent as the US and Canada slow to 2.6 percent and 2.0 percent respectively in 2019, (Figure 4).
From Armada Executive Intelligence September 26th: (Before the latest IMF update.)
“The steady drumbeat of bad news and even worse forecasts from the likes of the IMF, OECD, Group of 25 and others is enough to make anyone in the global business community a little queasy. If there is anything useful coming from all this doom it is that most of the assessments have identified the same problems and that would suggest there might be common solutions brought forth at some point. Number one is simply slow growth. This suggests that most of the nations of the world are suffering from slow internal progress and without domestic demand there is not much reason to import. The solution is simple enough to state but very hard to implement. These countries need to grow and that means some form of stimulating. This has been the call from the central bankers – find a way to back away from austerity and budget discipline long enough to spark the economy. Number two is exceedingly slow recovery in Europe. This is now considered the epicenter of global malaise as even the Germans are struggling to hold their own. The US engine has always been dominant as far as trade but the Europeans were right behind and today they barely figure in. Number three is that the emerging markets are no longer emerging and most are in retreat. Gone are the days of talking about these states as the next big thing – with the exception of China they are struggling just to stay out of recession and the prognosis for high flyers like Brazil have become bleaker by the week. Number four is that Latin America is losing its punch as the US has reduced its demand for commodities and all that trade that was supposed to be directed towards Asia has fizzled. The one exception to that rule has been Mexico as it seem to have recovered some of its growth. The last of these issues is geopolitics and that has been tricky of late. The list is getting long and complex – Ebola. ISIS, Ukraine, and so on and so on. The problem is that nobody really knows what to do with all this and resolution seems far in the future.”
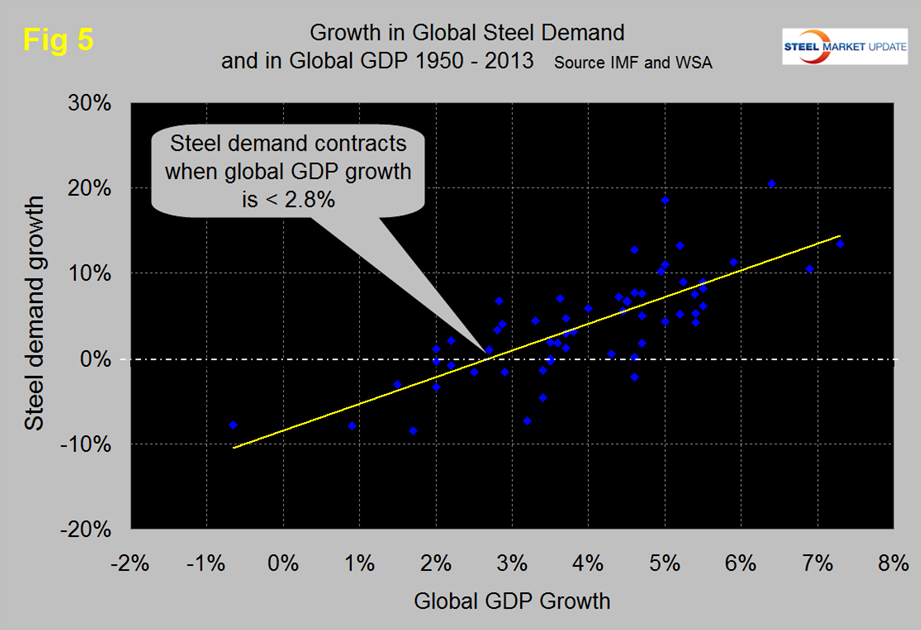
There is a relationship between the growth of GDP and steel demand at both the international and national level which also extends to other commodities such as cement. There are two interesting aspects to this relationship. First the cyclical change in steel demand is vastly more volatile than the change in GDP which we attribute to the inventory response throughout the supply chain. Secondly, as discovered by our friends at “Steel Guru,” is that 1 percent growth in GDP does not result in 1 percent growth in steel demand. At the global level it takes a 2.8 percent increase in GDP to get any increase in steel demand, (Figure 5). This is a long term average over a period of 64 years and based on the added volatility of steel can be a predictor of the immediate future. For example, after the disastrous decline in steel demand in 2009 there was no doubt that a huge cyclical rebound would occur as inventory managers throughout the world began to react to the economic recovery. If the IMF forecast proves to be correct, then the growth in steel demand through 2019 will settle in close to the yellow line in Figure 5 with a growth in steel demand of about 3.5 percent per year. We confess we haven’t yet figured out why the growth of steel and the economy don’t cross at zero but it does appear to be a fact that is born out in our examination of the US steel and cement markets and also by the steel market in Thailand for which we happened to have some data. In the US steel market it requires about 2 percent growth in GDP to generate growth in steel demand, therefore, if current forecasts prove to be correct regarding the US economy, we can expect the steel market to expand through 2019. This recovery in the US should exceed the long term average as construction digs its way out, manufacturing re-shores to the US and the oil boom drives the consumption of OCTG and other steel consumables.


