

Market Data

August 26, 2014
US Gross Domestic Product by Region and by State
Written by Peter Wright
Last Wednesday the Bureau of Economic Analysis published data for the GDP of each state for the first time ever. Data now exists from Q2 2005 to Q4 2013 by state and region. Steel Market Update will start doing a regular analysis of this data for our Premium level users but wanted to share our first report with everyone.
Table 1 shows the regional value of GDP in chained 2009 dollars for 2013 as a whole, the annual growth as a percentage and the ranking by growth.
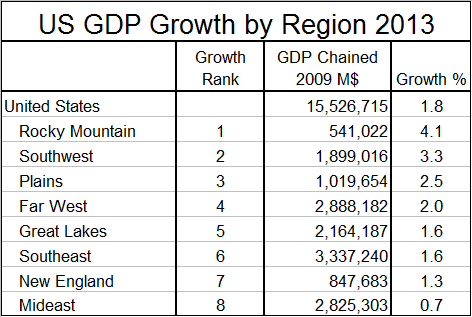
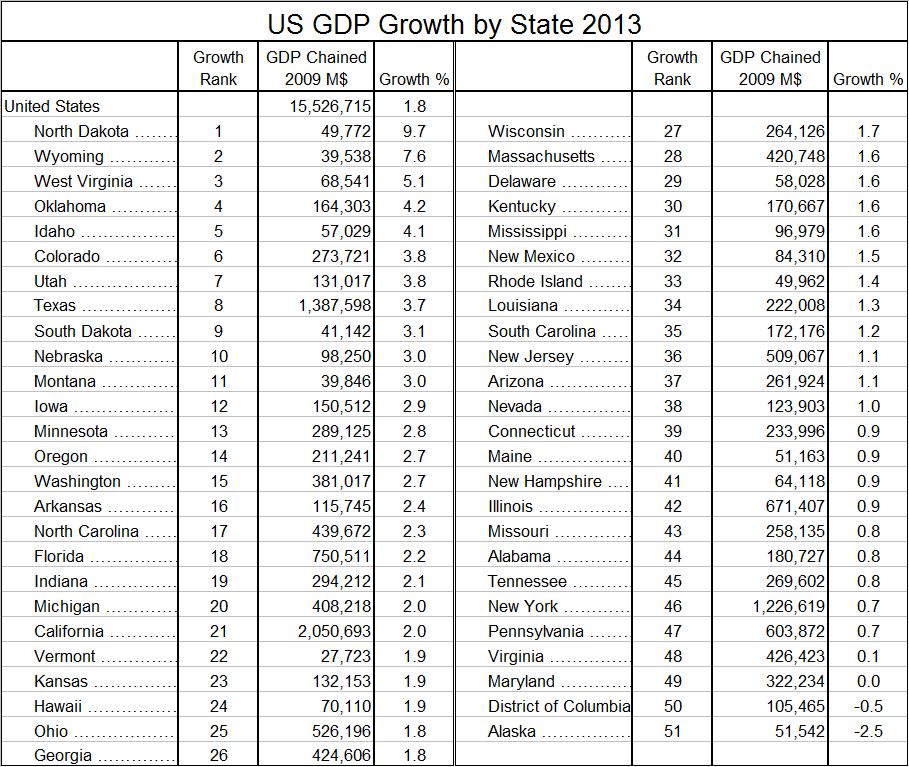
Table 2 does the same by state. On a regional basis the Rocky Mountains took first place in 2013 with a growth of 4.1 percent, the Mideast came in last with 0.7 percent. To put these results in perspective, the US as a whole grew by 1.8 percent in 2013. The states included in each region are shown below. Comparing the individual states shows that North Dakota came in first with a 9.7 percent growth and Alaska came in last with negative 2.5 percent.
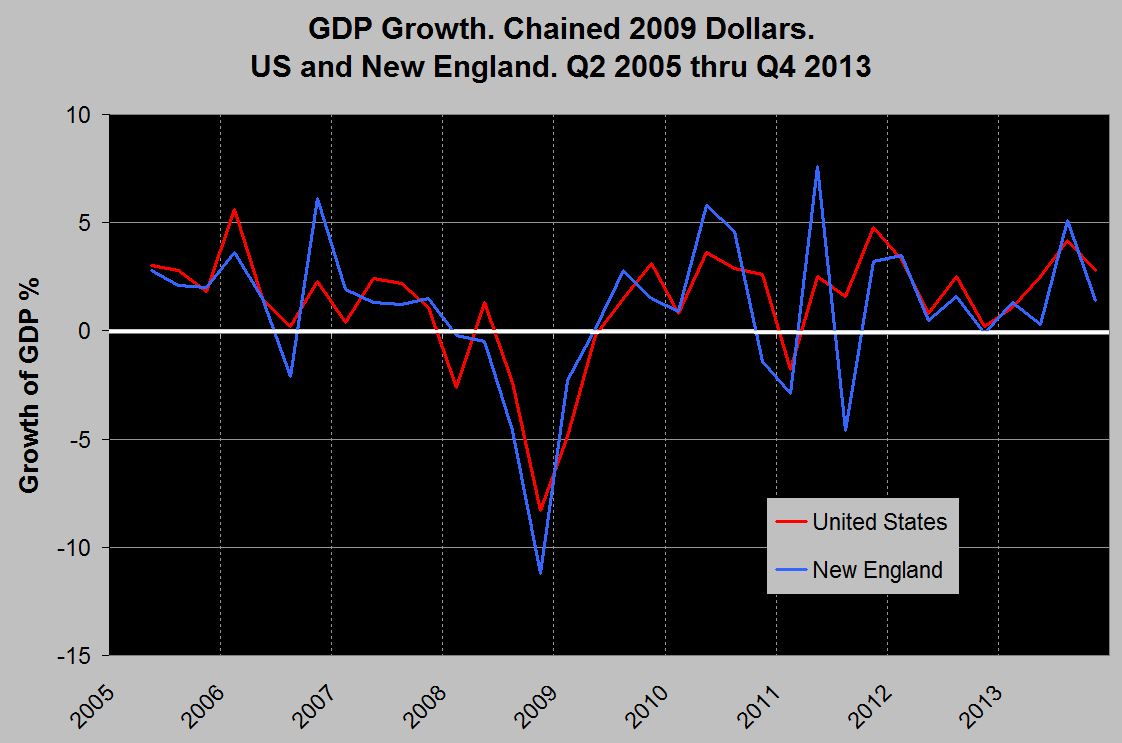
At SMU we believe that regional data is a quantum leap in value for readers over the national results and wherever possible in our various analyses we dig down to and report at the regional level. In a condensed report such as this we cannot provide a quarterly time series analysis for each state and region but for any reader who wants this information it can be provided on request. Figure 1 is an example of GDP growth by region quarterly since Q2 2005 and is typical of what we have for each state and region. In this case the region is New England and it can be seen that NE suffered worse than the US as a whole during the recession and that in 2013 growth was also below the national level.
Regions as defined by the BEA:
New England: Connecticut, Maine, Massachusetts, New Hampshire, Rhode Island, Vermont.
Mideast: Delaware, DC, Maryland, New jersey, New York, Pennsylvania.
Great Lakes: Illinois, Indiana, Michigan, Ohio, Wisconsin.
Plains: Iowa, Kansas, Minnesota, Missouri, Nebraska, North Dakota, South Dakota.
South East: Alabama, Arkansas, Florida, Georgia, Kentucky, Louisiana, Mississippi, North Carolina, South Carolina, Tennessee, Virginia, West Virginia.
South West: Arizona, New Mexico, Oklahoma, Texas
Rocky Mountain: Colorado, Idaho, Montana, Utah, Wyoming.
Far West: Alaska, California, Hawaii, Nevada, Oregon, Washington.
The U.S. values in this report differ from the National Income and Product Account (NIPA) values because of revisions to the NIPA values as well as the GDP-by-state accounts excluding Federal military and civilian activity located overseas (because it cannot be attributed to a particular state).


