Market Data

August 19, 2014
Service Center Apparent Deficit for July -193,000 Tons
Written by John Packard
Service center flat rolled shipments rose by 7 percent or, 1 percent more than we had forecast when we last produced our Apparent Excess/Deficit report for our Premium subscribers. Flat rolled shipments in July averaged 108,800 tons per day up from the 101,700 tons per day shipped last July.
At the end of June we calculated service centers were short flat rolled inventory by 351,000 tons (-351,000). By the end of July the inventory deficit had been reduced by 158,000 tons and now stands at -193,000.
Our forecast for July was -229,000 tons after making an inventory adjustment of 200,000 tons to accommodate the excess foreign steel moving into distributors inventories.
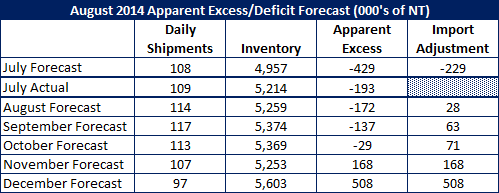
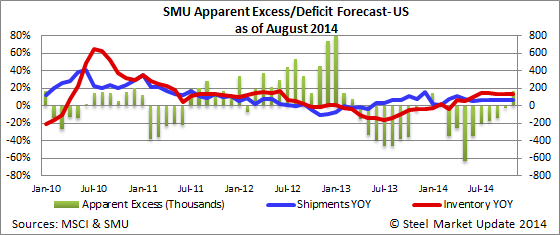
As we look at August through September shipment and inventory levels for flat rolled, we are forecasting 6 percent growth in shipments year-over-year. This takes the daily shipment rate for August up to 114,000 tons per day. We are also projecting that the growth will remain at 6 percent for the balance of the year and we will adjust as the market changes. The daily shipment rate shown in our table above includes a 6 percent growth rate.
Steel Market Update is forecasting that the inventory deficit will be eliminated by the end of August. With an Excess of +28,000 tons the distributors inventories should be essentially “balanced” at the end of August.
Based on our projected shipments and receipts (including adding extra tons to accommodate foreign receipts in August, September and October) we are forecasting service center inventories to be in a slight excess position (between zero and +100,000 tons) for August, September and October and then for the excess to grow in November and December.
If our forecast is correct, as the excess inventories grow there would most likely be adjustments made in domestic mill order books thus pressuring prices during the months of November and December.
Here is a graphic of the history and our forecast for shipments and the Apparent Deficit/Excess (by the way, we do have an interactive graphic of Apparent Excess/Deficit under the Analysis-Economic Data-Apparent Excess/Deficit):