
Prices

August 19, 2014
Global Steel Production and Capacity Utilization in July 2014
Written by Peter Wright
Production in July on a tons per day basis was 4.415 million metric tons, down from 4.590 in June. This was the first month since February when production was less than 4.5 million tons per day. This is not a seasonal effect. Since January 2008 on average, July production has been about the same as June. The three month moving average (3MMA) of production in July on an annualized basis was 1.663 billion tons and a capacity utilization of 78.4 percent, (Figure 1).
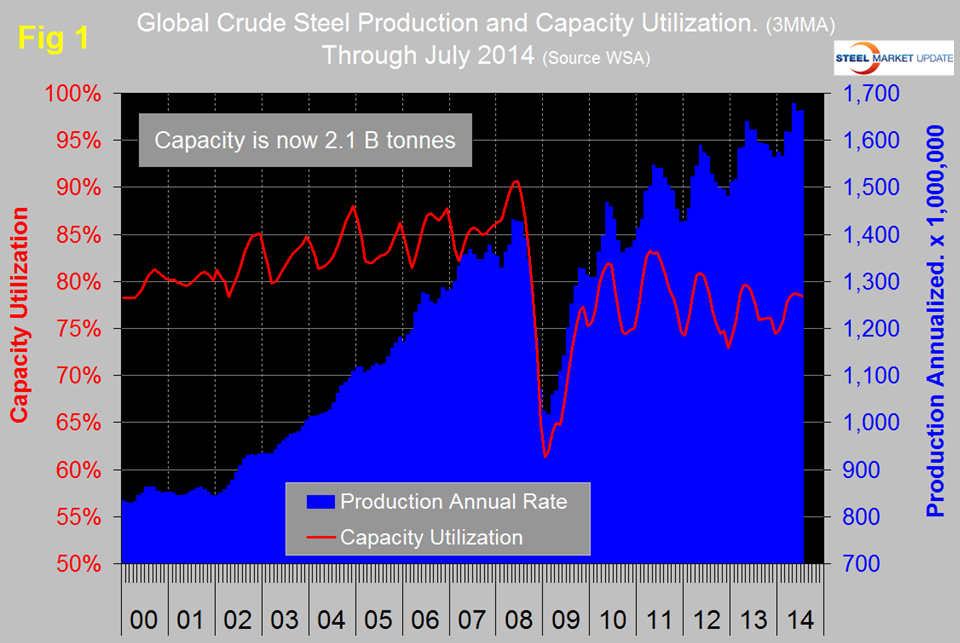
Capacity is now 2.076 billion tons. Table 1 shows regional production in the single month of July with regional share of the global total, also three months production through July and YTD production. Regions are shown in white font and individual nations in beige.
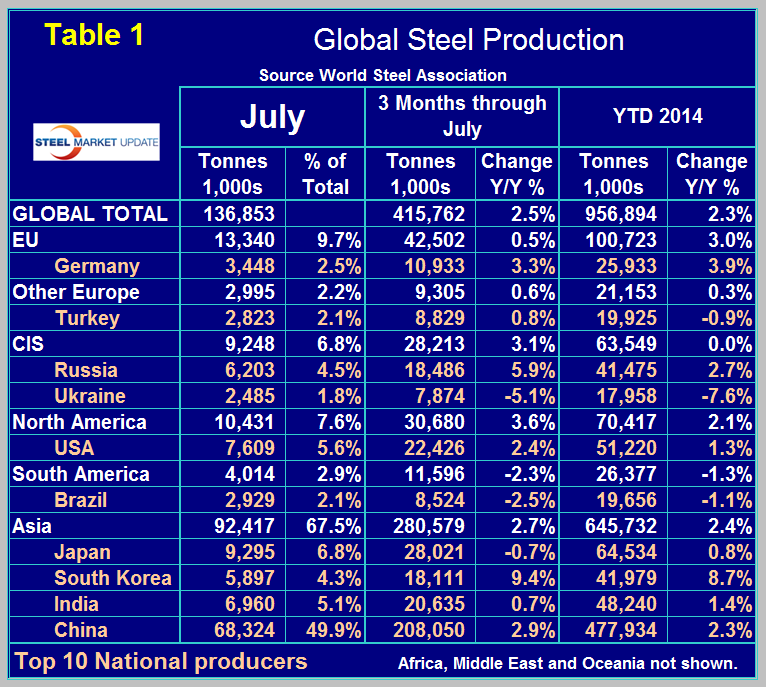
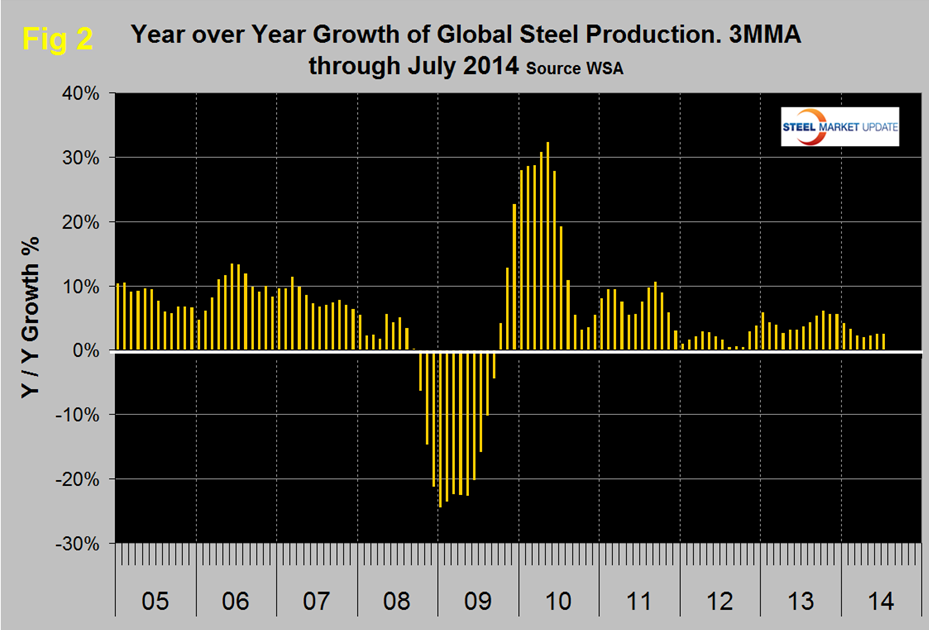
In three months through July, year over year global growth was 2.5 percent, year to date was 2.3 percent–both measures were down slightly from the June report. All regions except South America had positive y/y growth in three months through July. The European Union which had the fastest growth rate in early 2014 continued to slow and achieved only 0.5 percent in three months through July. Excluding Germany, which had a positive 3.3 percent growth rate, the rest of the EU was negative. Year over year growth of output in the NAFTA was 3.6 percent in three months through July with the US lagging at 2.4 percent. Canada achieved 8.6 percent and Mexico 7.1 percent. South America had negative 2.3 percent growth through July with its largest producer, Brazil, down by 2.5 percent. Growth in Asian production was 2.7 percent, once again led by South Korea at 9.4 percent. In the single month of July, China’s production grew by 1.5 percent compared to July last year with a three month moving average (3MMA) of 2.9 percent. China’s 3MMA growth rate has slowed from double digits in the first half of last year and in three months through July its share of global production fell to <50 percent. Is this a sign of the much reported policy of growth curtailment? Maybe, maybe not! North America produced 7.6 percent of the global total in July. Figure 2 shows that the year over year growth of global production has increased slightly since April. (Source: World Steel Association)