Analysis

August 18, 2014
Oil and Gas Prices and Rotary Rig Counts
Written by Peter Wright
The Energy Information Administration (EIA) has just released data on global oil production for 2013. The global total was just over 90 million barrels per day (bpd). The Middle East and North America produced 27,170,000 and 19,285,999 bpd, respectively. The United States was the world’s top oil producer at 12,302,000 bpd followed by Saudi Arabia with 11,592,000 bpd.
Mark Perry, in an article published by Seeking Alpha on August 14th, summarized as follows: “Bottom Line: The EIA data on international petroleum production through April provides more evidence that America’s shale energy revolution is taking the US from “resource scarcity” to a new era of resource abundance. The US now consistently produces more total oil supply than Saudi Arabia. This energy bonanza in the US would have been largely unthinkable even five years ago. But then thanks to revolutionary drilling techniques developed by American “petropreneurs,” vast oceans of shale oil have been accessed across the country, making the US the world’s No. 1 petroleum producer for 18 months running.”
SMU Note: In 2004 only 9 percent of rigs were drilling horizontal wells. In 2014 that number is up to 69 percent.
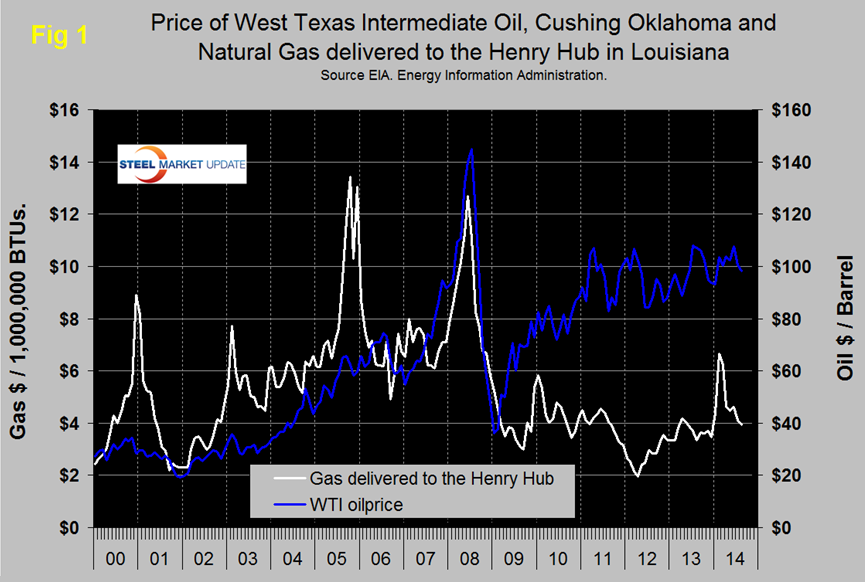
Figure 1 shows historical gas and oil prices since January 2000. The daily spot price of West Texas Intermediate fell below $100 in August and was $98.09 on August 11th, the latest daily figure available from the EIA. Brent closed at $103.47 on the same day. Natural gas delivered to the Henry Hub in Louisiana fell below $4.00 in August and on the 8th and closed at $3.92 / million BTUs. After the cold weather spike in February, Natural Gas has declined to a level 17 percent higher than it was in August last year. The EIA reported as follows at the close of July results: “The market’s perception of reduced risk to Iraqi oil exports and news regarding increasing Libyan oil exports contributed to a drop in the Brent crude oil spot price to an average of $107 per barrel (bbl) in July, $5/bbl lower than the June average. EIA projects Brent crude oil prices to average $107/bbl over the second half of 2014 and $105/bbl in 2015. West Texas Intermediate (WTI) crude oil prices fell from an average of $106/bbl in June to $104/bbl in July, despite record levels of U.S. demand for crude oil. The WTI discount to Brent, which averaged $11/bbl in 2013, is expected to average $8/bbl and $9/bbl in 2014 and 2015, respectively, both $1/bbl lower than projected last month. Natural gas spot prices fell from $4.47/million British thermal units (MMBtu) at the beginning of July to $3.78/MMBtu at the end of the month as natural gas stock builds continued to outpace historical norms. Natural gas working inventories on August 1 totaled 2.39 trillion cubic feet, tcf) 18 percent below the level at the same time a year ago. Projected natural gas working inventories reach 3.46 tcf at the end of October, 0.35 tcf below the level at the same time last year. EIA expects that the Henry Hub natural gas spot price, which averaged $3.73 per MMBtu in 2013, will average $4.46/MMBtu in 2014 and $4.00/MMBtu in 2015, $0.31/MMBtu and $0.51/MMBtu lower than in last month’s STEO, respectively.
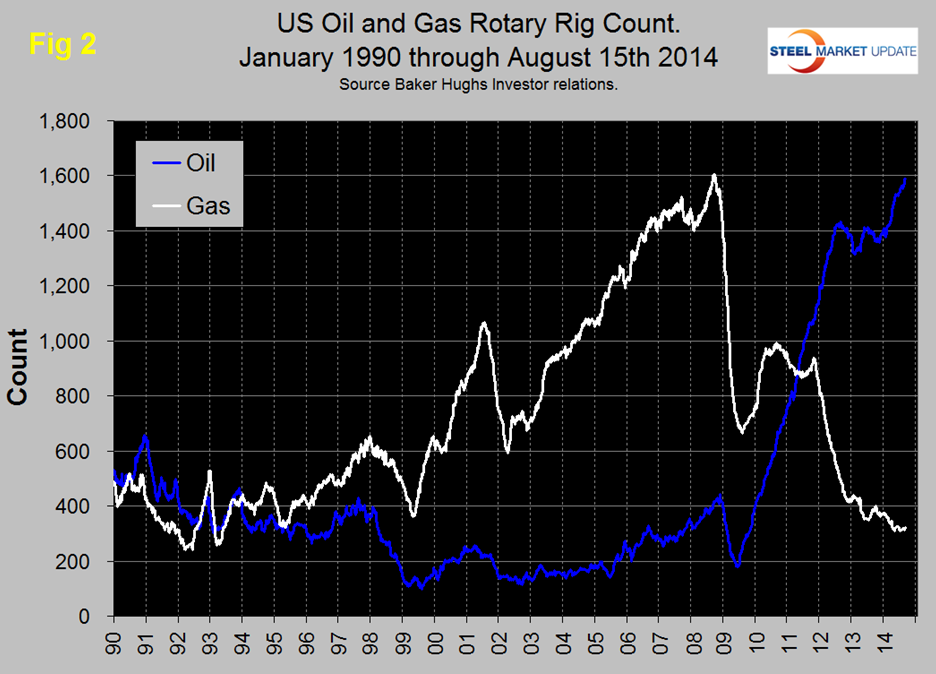
Figure 2 shows the Baker Hughes North American Rotary Rig Count which is a weekly census of the number of drilling rigs actively exploring for or developing oil or natural gas in the United States and Canada. Rigs are considered active from the time they break ground until the time they reach their target depth and may be establishing a new well or sidetracking an existing one. The Baker Hughes Rotary Rig count includes only those rigs that are significant consumers of oilfield services and supplies. Figure 2 shows that the oil rig count which had been trending flat for almost two years has continued to accelerate in 2014 and is now at the highest level in over 2 and a half decades. The gas rig count has trended flat since March and is at a level not seen since the mid-90s.
The total number of operating rigs is now 1913 an increase of 55 since we last published this analysis on June 17th. Land rigs increased by 52 in this time frame to 1851 and off shore by 3 to 62. On a regional basis the big three states for operating rigs are Texas at 899, up by 13 since June 20th, Oklahoma at 209, up by 9 and North Dakota at 185, up by 15. Off shore drilling has now recovered from the Deep Water Horizon oil spill in April 2010 but is still less than half what it was in January 2000.
From Armada Executive Intelligence Brief July 16th. One item we have to keep in mind is that the projected demand for oil may not rise as fast as production will rise. We would give you those charts, but the projections are changing very rapidly because of US, European, South American and even Asian production and development. And, there is enough uncertainty in the international economic environment that most demand studies are inaccurate. We need to keep an eye on one particular item. Dropping oil prices is good for most corporations in the US, it improves consumer discretionary income and the only industry that really gets hit because of a drop in oil prices is the petroleum and rail sectors. Most analysts believe that the shale oil industry have a breakeven point of about $70 a barrel. Congress is likely to consider opening up exportation of US crude oil if we continue to see record inventory levels.
Domestic Petroleum Production Surging in Permian Basin. The oil economic boom in the Bakken Shale Formations in the North-Central regions of the US have been well reported. Workers can’t find enough housing, infrastructure can’t keep pace with usage, tax revenues in those states are surging, and part time workers at fast food restaurants are able to make $15 an hour or more. It’s a boom just like we saw in the Gold Rush days of the 1800’s. But, that’s not the only exciting growth story in the country. The Permian Basin in Texas is also an emerging boom story. It was once the home of the biggest oil producing operations in the country – and with new shale oil extraction technologies, it could become the largest once again. We have written about this in the past and tipped you off to the re-emergence of it several months ago. Now, the Energy Inform Now, the Energy Information Administration has published some new data about the region and the explosion of production. Consider the booming economic benefits to areas like the Bakken – there is no reason to believe that the Permian Basin region in Texas won’t be destined for perhaps even greater growth.
Remember the mansions and significant money that emerged out of Texas during the “Gusher Age” from 1901 to 1940 during the first oil boom? That time is coming back once again. If you price houses in Austin, Texas today, you can see the surge in inflationary conditions around the region. One source has said that the shale formation zone in the Permian Basin could be as much as 10 times more plentiful for oil production than the Eagle Ford zone in Eastern Texas. The bottom line is that there is tremendous potential here and developers know it. Everything from petroleum sector expansion to the economic engine that supports those operations will see significant growth in the rest of 2014 and into 2015 if oil prices stay in a range between $90 and $110 a barrel.
In order for the Federal Government to ensure that oil companies can continue to afford to expand and grow these regions, create jobs, create demand for manufactured goods and transportation services, Congress will have to allow the exportation of crude oil. At some point in time in the near future, the US will be oversupplied with oil and the price per barrel will plummet. That’s great for consumers, but it could spell and end to this boom if it isn’t managed correctly. This is one instance in which we need Congress to act in order to preserve this private enterprise and the supporting industries around it. And, given the speed with which these regions are booming – they need to act quickly. As mentioned in the piece above, pulling the geopolitical premium off of oil has sent the price of West Texas Intermediate below $100. If the risk premium is more than $10 right now, that would put the real price of oil somewhere below $90 – and dangerously close eventually to the $70 breakeven point for this oil production as mentioned.
SMU’s view is unchanged from last month; the evolution of the North American energy market is good news for future steel demand. We believe that market trends for natural gas will eventually result in higher prices and a virtuous spiral in production as supply stimulates demand from such industries as power generation and direct reduced iron among many others. Also the restrictions on LNG exports are likely to be relaxed in the face of threats and restrictive actions by Gazprom.


