Market Data

July 10, 2014
Access to SMU Steel Survey Results
Written by John Packard
Steel Market Update is providing our Executive members access to Premium sections of our website as well as Premium supplement newsletters for the month of July. We are doing this in an effort to educate our customers on what is available at the Premium Level should you wish to upgrade to Premium Level membership at some point in time in the future.
During the month of July, SMU will produce a series of articles pointing out some of the areas of the website that Executive members might want to explore as the month progresses. Today our article will focus on our “Survey Results” since we have just concluded our early July flat rolled steel market analysis.
If you are an Executive Level subscriber (Executive Level are those who continue to receive our basic newsletter three times per week and do not have full access to all areas of the website) you have no doubt come across references to SMU’s flat rolled steel market survey and even seen specific results referenced in our articles. We have a few articles in tonight’s newsletter which came from the results of this week’s analysis of the flat rolled market (our survey).
During the day on Friday our latest survey results will be downloaded into our website (we should have online by mid morning). To find the survey results you go to the Analysis tab and scroll down the drop menu to survey results and then scroll over to the second menu and at the bottom will be the complete survey results tab. Click on it and the most recent survey will automatically ask for you to save it or download it as a PDF. If you load it as a PDF you can review the results right then and there. If you go to this area this evening or first thing on Friday morning you will access the survey results we collected during the middle of June. Later in the day we will have this week’s results posted.
If you are unaware of what our full survey results entail, let me shed a little light on the value and content of our survey data.
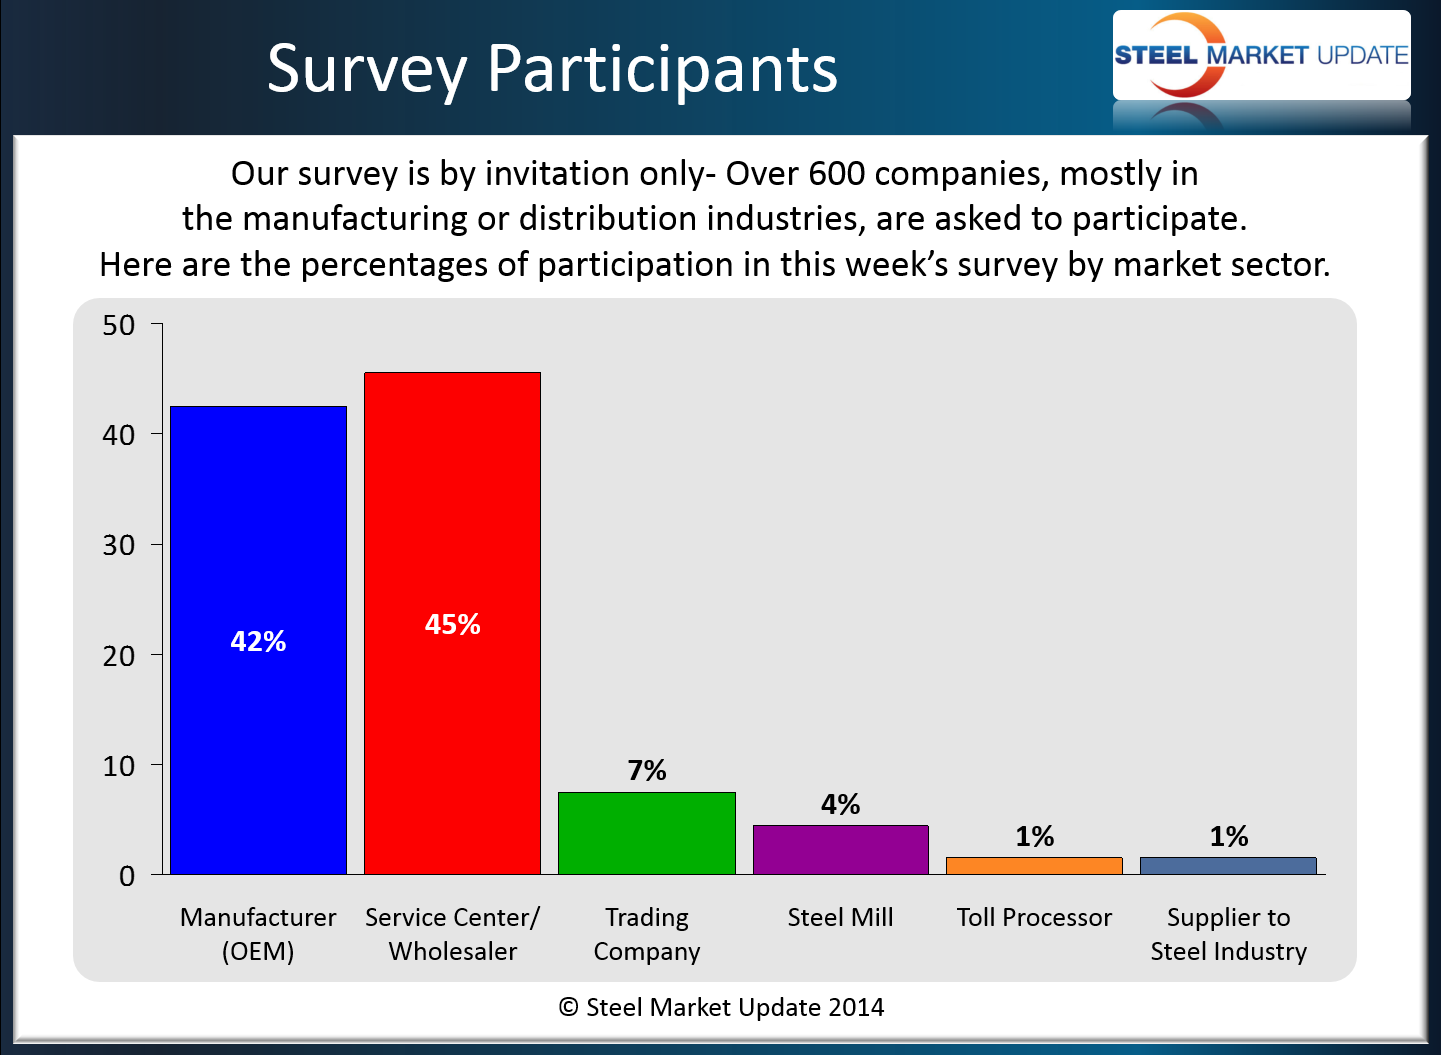
First, our survey is administered twice a month when we invite a little over 600 companies to respond to our questionnaire. A typical response expected out of any one survey is 110-170 companies. Of those responding usually 50 percent are manufacturers, 40 percent are service centers, and the remaining 10 percent are represented by trading companies, mills, and toll processors. In this week’s survey we actually saw a slightly different pattern with 42 percent manufacturer and 45 percent service center with the remaining 13 percent being steel mills, trading companies and toll processors.
Most of our readers are familiar with SMU’s “Steel Momentum Indicator” and our “Buyers Sentiment Index”. These represent just two data sets out of the dozens which make up our survey. There is quite a bit of information generated by each survey and we have chosen to share a good portion of that data with our Premium Level members.
Our respondents begin the survey process by answering a series of questions through which we can get basic information from the group as a whole (demand trends for example). We then break the group into market segments where they are asked a series of questions related to their segment. At this point we delve a little deeper into questions about demand, inventory and inventory management, buying decisions, lead times, price negotiations and steel prices (both foreign and domestic).
Our Premium Level members are then provided a Power Point presentation of specific groupings of questions and responses along with an analysis of the trend. This is done visually through the graphics that you sometimes see in our articles but most of the information shared is not seen by our Executive Level membership.
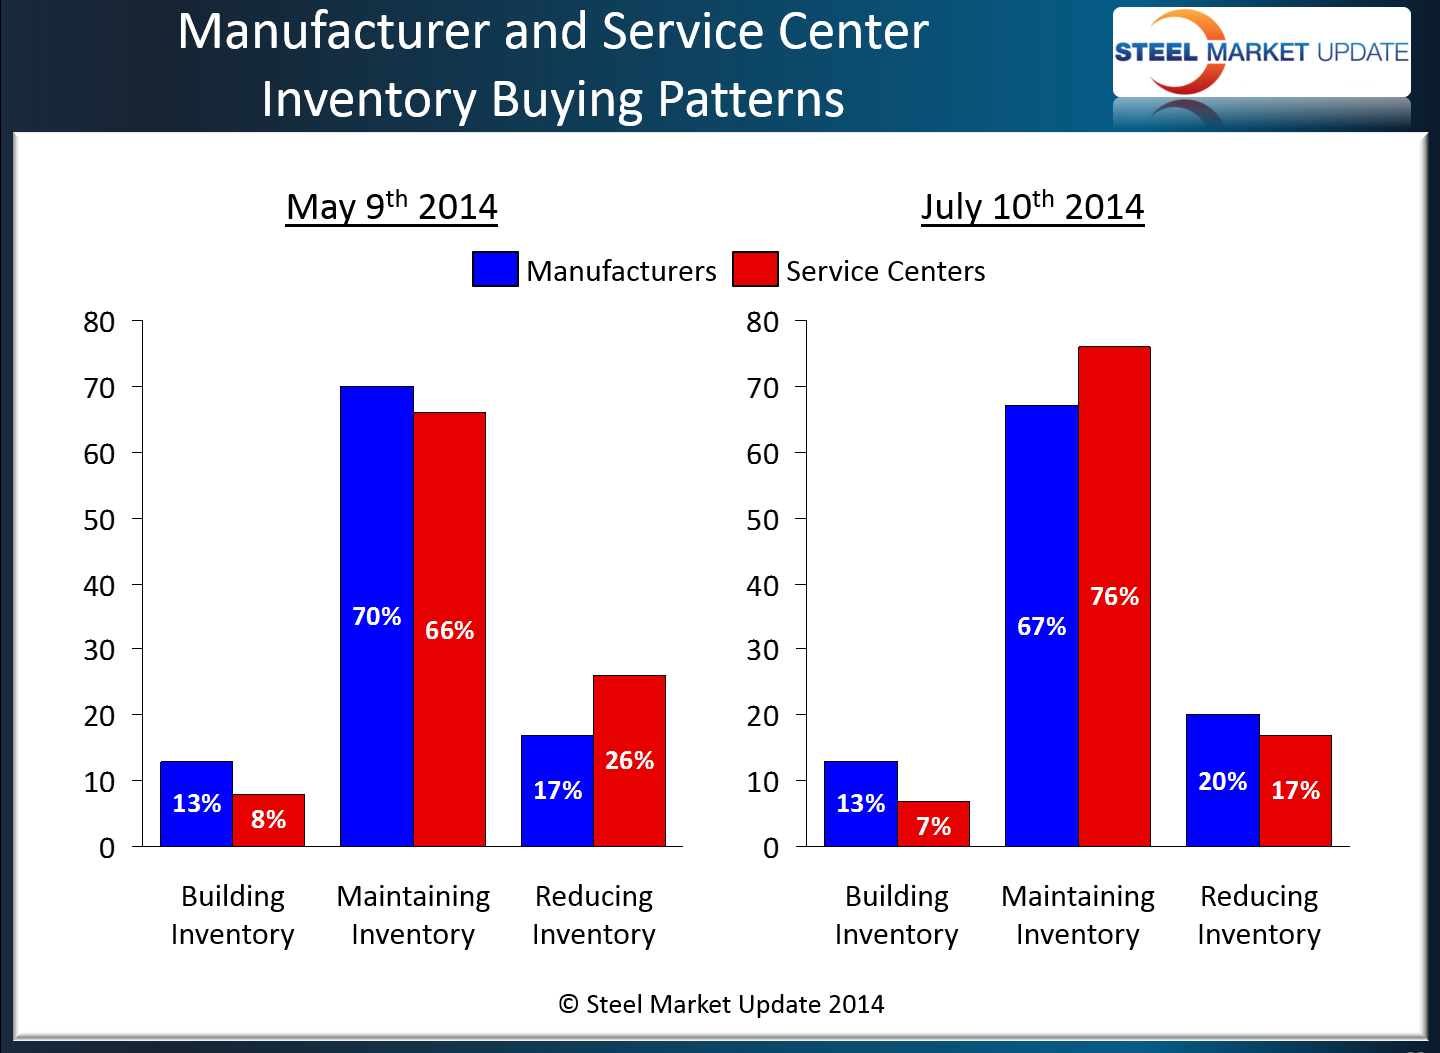
A Good example is an analysis of the buying patterns of manufacturers and service centers. This is a report we have been building since 2009 and we share that history with our Premium Level members.
The survey results are a very important pieces of data which when studied can provide insights into pricing trends, demand trends, inventory trends and more for those who are looking for unique information to help your company strategically plan and manage your business.
If you haven’t downloaded our survey result before, you may do so by logging into www.steelmarketupdate.com and navigating to the survey results page. From the homepage, simply go under the analysis tab and click “survey results”, and then on the list of options on the right side of the page, click “SMU Survey Results (P)”. This should trigger a pdf file to download to your computer.
We hope that you will take advantage of this temporary access to our survey data. We are sure that you will find it to be of value.
If you would like to learn more about the values associated with Premium Level membership please feel free to contact us: info@SteelMarketUpdate.com or by phone: 800-432-3475.


