Analysis

June 17, 2014
Housing Starts, Permits and Builder Confidence through May 2014
Written by Peter Wright
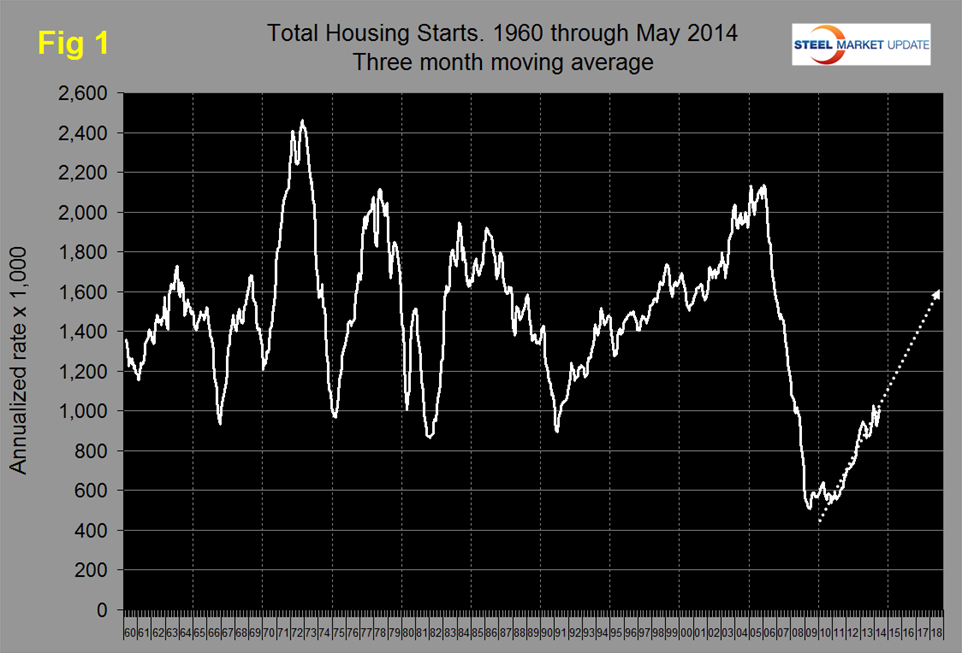
Total housing starts declined from 1,071,000 in April to 1,001,000 in May but the three month moving average (3MMA) increased from 983,000 in April to 1,007,000 in May. It looks as though April was a bounce back from the severe winter delays and that May reverted to trend. Figure 1 shows total housing starts from 1960 and projected through 2018. At the present rate it will be the end of 2018 before total starts break through the 1.6 million annual rate line.
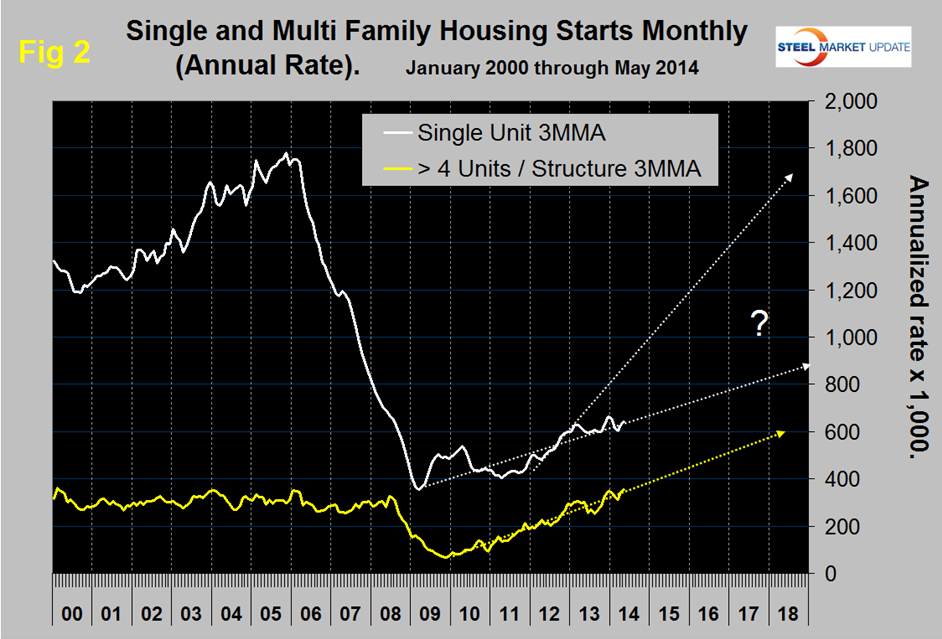
Figure 2 breaks the total down into single and multi-family housing units. Multi-family are now beyond the pre-recession level but single units continue to struggle.
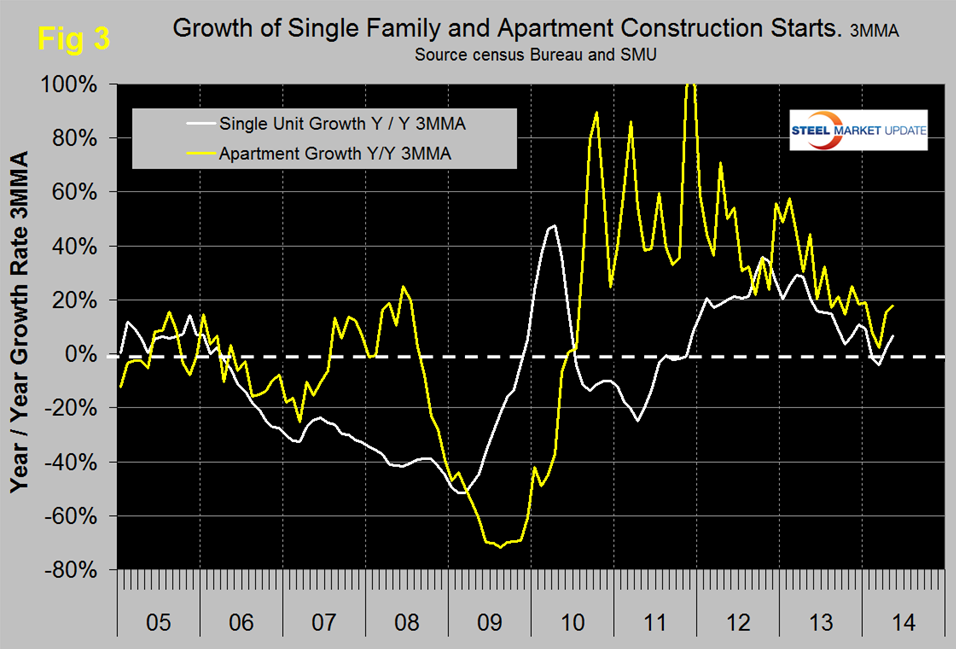
The growth rate of both sectors has slowed markedly since the beginning of last year and now stands at 17.7 percent and 6.8 percent for multi and single family respectively, (Figure 3).
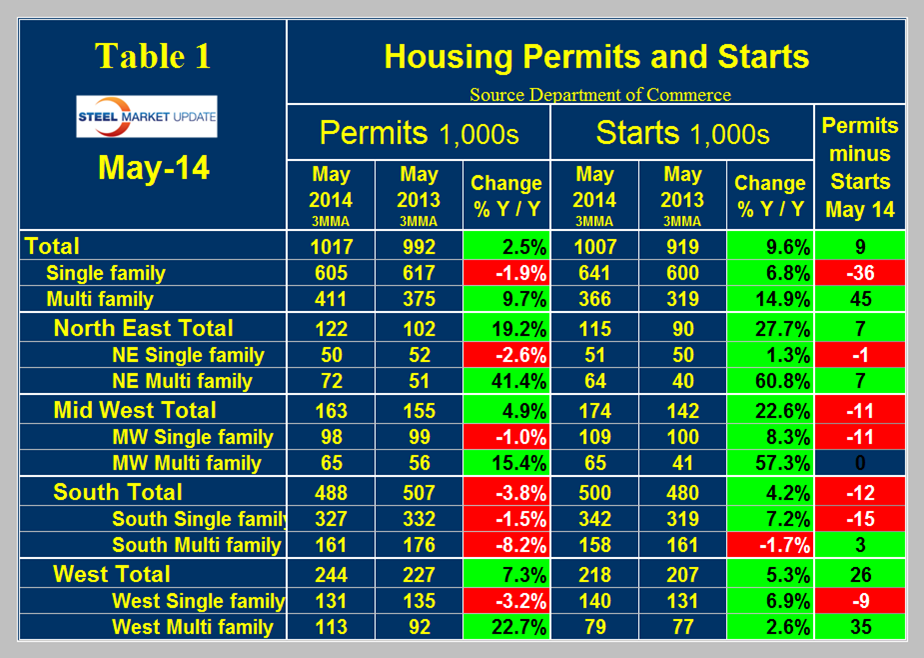
Permit data is useful to evaluate where future starts are headed. If permits exceed starts then we anticipate an acceleration and vice versa. Table 1 shows that total permits did exceeded starts by 9,000 in May on a 3MMA basis.
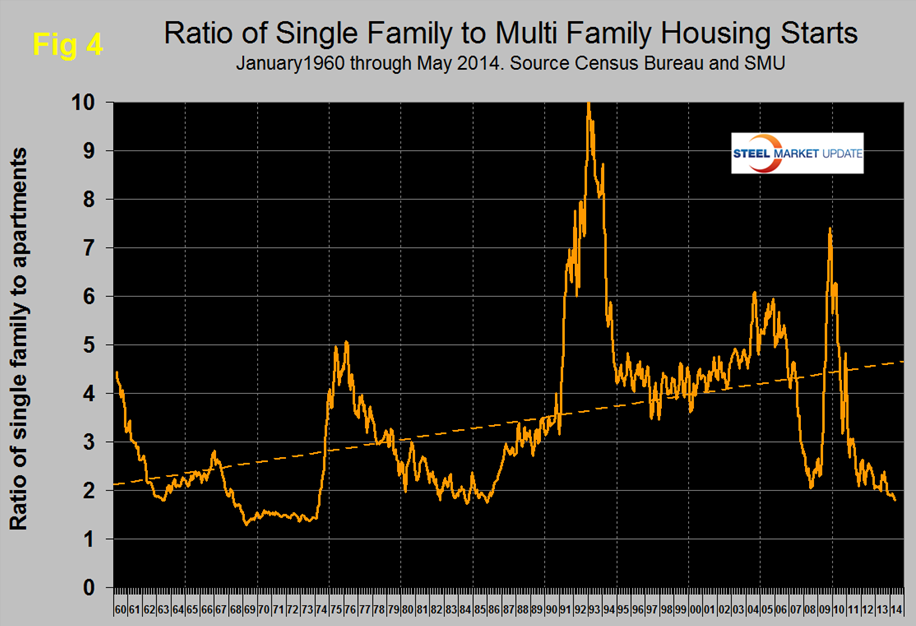
However, the situation is dramatically different for single and multi-family units. Single family permits were 36,000 less than starts and multi-family permits were 45,000 more than starts. This signals a future acceleration in multi-family and a deceleration in single family. The ratio of the two sectors is shown in Figure 4 and demonstrates that single family compared to multi-family is less desirable than at any time in the last 30 years. Based on permit data this trend will not change any time soon. The situation in the four regions reported in the census Bureau report mirror that at the national level. In all regions, permits for single family are less than starts and in all regions except the Mid-West (which broke even), permits for multi-family exceed starts. We are witnessing a dramatic change in the consumer’s view of how he/she wants to live. The balloon in student loan debt is one of the fuels of this trend but so, presumably, is the view that housing is not necessarily the great investment that it was once thought to be.
The National Association of Home Builders confidence report released this week is somewhat at odds with our conclusions described above. The index for newly built, single-family homes rose four points in early June. It remains one point shy of the threshold for what is considered good building conditions. The official report reads as follows:
“After several months of little fluctuation, a four-point uptick in builder sentiment is a welcome sign and shows some renewed confidence in the industry,” said NAHB Chairman Kevin Kelly, a home builder and developer from Wilmington, Del. “However, builders are facing strong headwinds, including the limited availability of labor.”
“Consumers are still hesitant, and are waiting for clear signals of full-fledged economic recovery before making a home purchase,” said NAHB Chief Economist David Crowe. “Builders are reacting accordingly, and are moving cautiously in adding inventory.”
Derived from a monthly survey that NAHB has been conducting for 30 years, the NAHB/Wells Fargo Housing Market Index gauges builder perceptions of current single-family home sales and sales expectations for the next six months as “good,” “fair” or “poor.” The survey also asks builders to rate traffic of prospective buyers as “high to very high,” “average” or “low to very low.” Scores for each component are then used to calculate a seasonally adjusted index where any number over 50 indicates that more builders view conditions as good than poor.
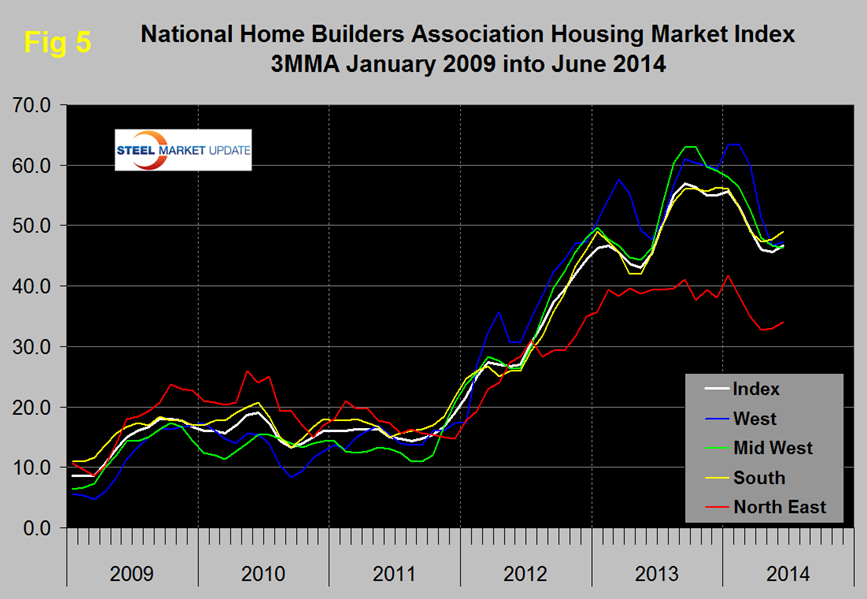
All three index components posted gains in June. Most notably, the component gauging current sales conditions increased six points to 54. The component gauging sales expectations in the next six months rose three points to 59 and the component measuring buyer traffic increased by three to 36.
Looking at the three-month moving averages for regional HMI scores, the South and Northeast each edged up one point to 49 and 34, respectively, while the West held steady at 47. The Midwest fell a single point to 46, (Figure 5).
SMU Comment: Even though the steel content of housing is only a small proportion of total steel consumption, housing is a leading indicator of many construction sectors such as non-residential and sub sectors of infrastructure and has a large multiplier effect in the economy as a whole. To the extent that readers businesses are influenced by the relative size of the two housing sectors they should plan for further continued growth of apartment construction and a single family sector that continues to struggle.


