Market Data

June 9, 2014
Net Job Creation through May 2014
Written by Peter Wright
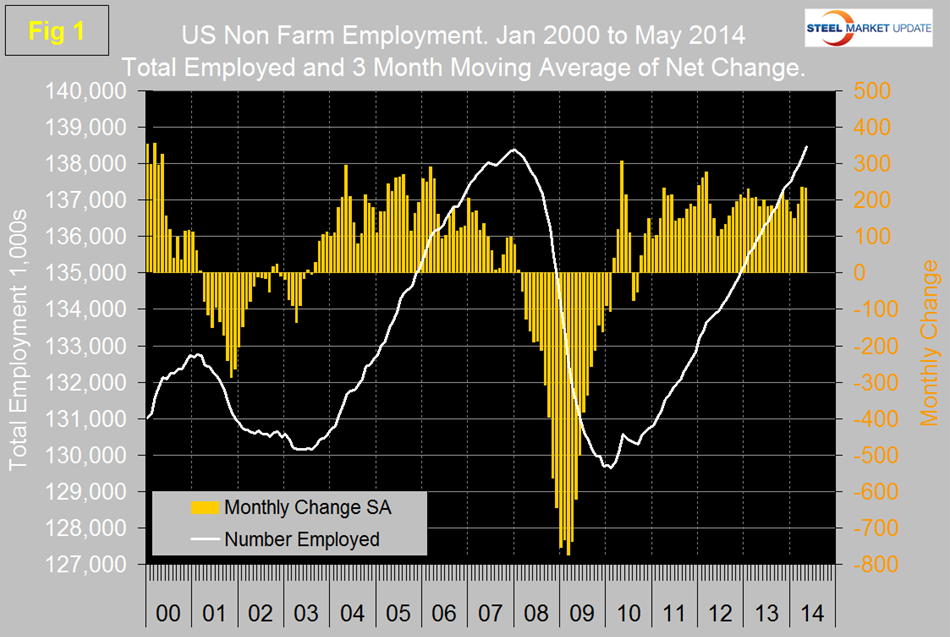
The Bureau of Labor Statistics (BLS) report on non-farm employment indicated that 217,000 jobs were added in May, April was revised down by 6,000 to 282,000 and March was unchanged. The three month moving average (3MMA) rose from 190,000 in March to 236,000 in April then declined by 2,000 in May, (Figure 1). All numbers in this analysis are seasonally adjusted by the BLS.
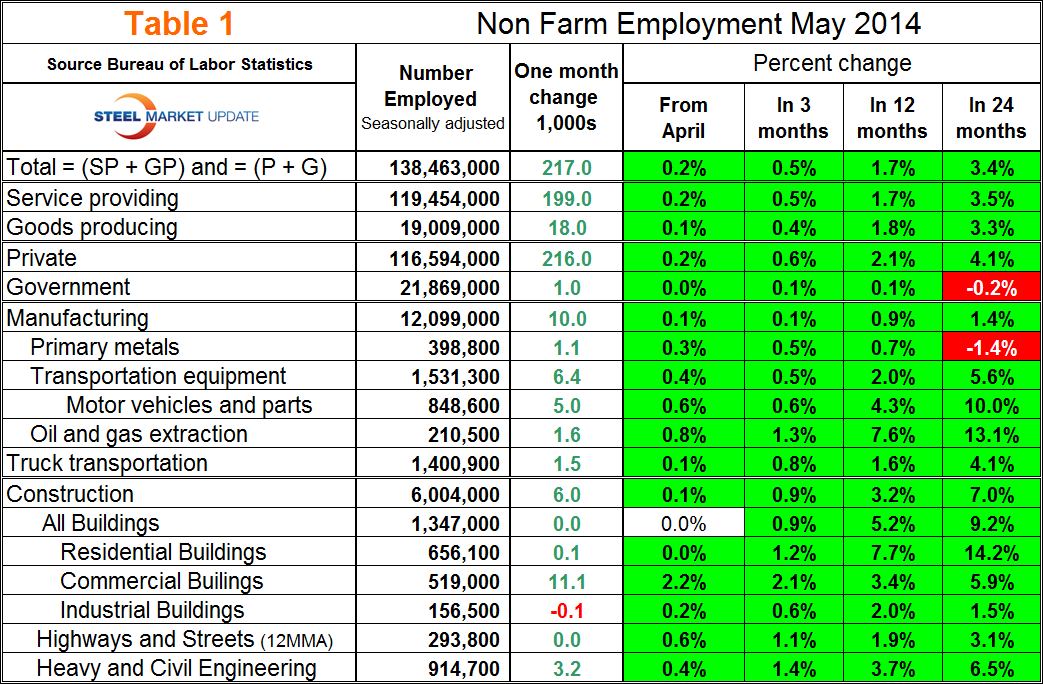
The total number of people employed in the US is now 138.463 million and for the first time exceeded the previous peak of 138.365 million in January 2008, however the underlying level of participation rate and under-employed has a very long way to go to absorb the estimated 7.2 million entrants to the working age population since 2008. Three sectors account for more than two-thirds of jobs that have been created since the recovery began. These are: business/professional services, education/healthcare and leisure/hospitality. While the first two create many quality jobs, leisure/hospitality jobs are among the lowest paying. Table 1 slices total employment into service and goods producing industries and then into private and government employees.
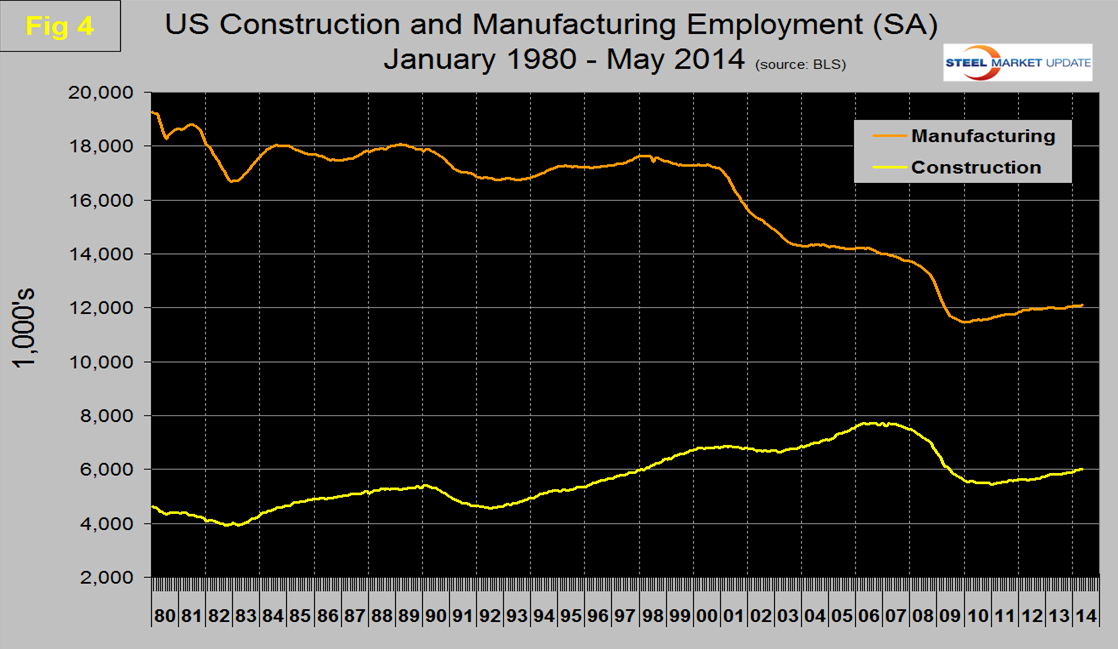
Total employment equals the sum of private and government employees. It also equals the sum of goods producing and service employees. Most of the goods producing employees work in manufacturing and construction and these sectors are further subdivided in Table 1. In May private employment grew by 216,000 and government by 1,000. Service industries expanded by 199,000 and goods producing by 18,000 people. The growth of service and goods producing industries has been similar for the last one, three, twelve and twenty four month periods. Private sector employment has expanded by 4.1 percent in the last 24 months as government has contracted by 0.2 percent. The growth of construction employment outpaced manufacturing for the last 3, 12 and 24 month periods but in May slowed to a 0.1 percent growth rate, the same as manufacturing. Of the net new goods producing jobs gained in May, 6,000 were in construction and 10,000 in manufacturing. In the last 24 months construction has added 391,000 jobs as manufacturing has expanded by 171,000.
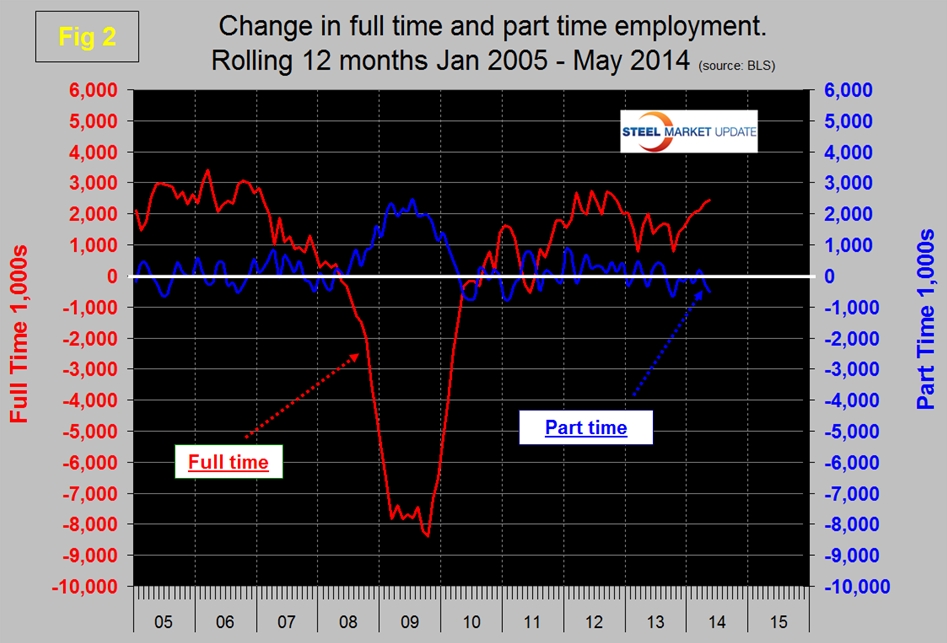
Virtually all of the growth in employment since 2010 has been in full time work with almost a net zero increase in part time employment, (Figure 2).
The global outplacement consultancy Challenger, Gray & Christmas, Inc. issued the following press release last week. At SMU we see relevance in this report as a reality check on other data sources that we use to evaluate the direction and velocity of employment change.
2014 May Job Cuts: 52,961 Highest Monthly Total in 15 Months. 2014 Pace still the lowest since 997.
Job cuts climbed to the highest level in more than a year as US-based employers announced plans to reduce payrolls by 52,961 in May, according to the report Thursday from global outplacement consultancy Challenger, Gray & Christmas, Inc.
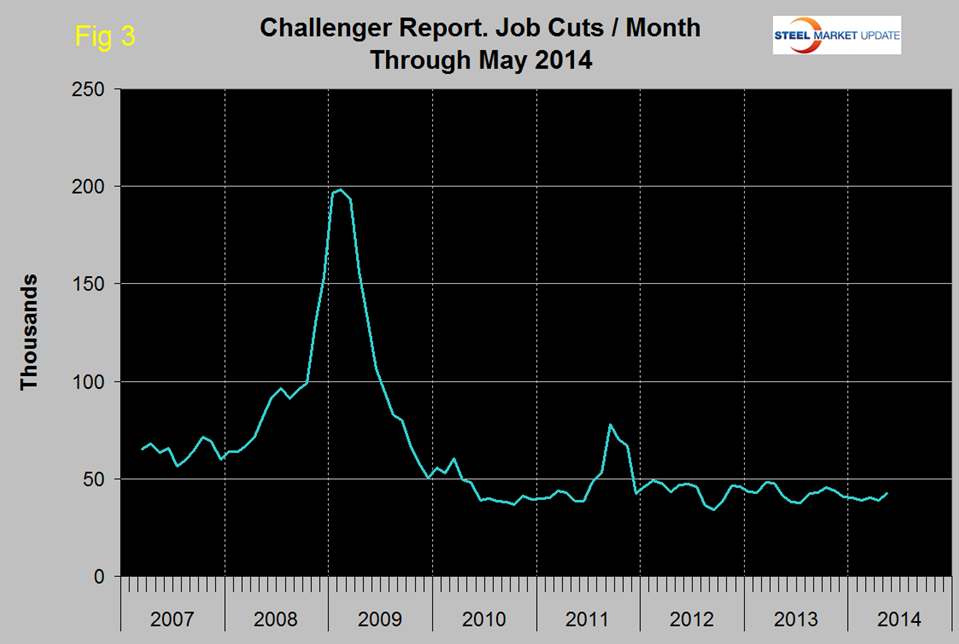
May job cuts were up 31 percent from 40,298 announced layoffs in April. It was the second consecutive increase in monthly job cuts and the largest one-month total since February 2013 when 55,356 job cuts were recorded. Last month’s total was 46 percent higher than the 36,398 job cuts announced in May 2013. To date, employers have announced a total of 214,600 planned job cuts in 2014, which is 2.3 percent fewer than the 219,560 job cuts tracked in the first five months of 2013, (Figure 3).
The heaviest downsizing in May occurred in the technology sector, where computer firms announced plans to cut payrolls by 18,799. Hewlett-Packard, which has announced several large-scale workforce reductions in recent years, revealed plans to cut as many 16,000 workers in its ongoing efforts to reengineer the workforce to be more competitive. Five-figure job-cut announcements have been rare since the recession ended in 2009. The last time we saw a figure on this scale was February 2013, when JP Morgan Chase announced a large reduction in the number of bankers in its mortgage unit, most of whom were hired in the wake of the recession to deal with the flood of foreclosures and the refinancing of troubled loans.
“Despite the May surge resulting from the latest H-P cuts, the overall pace of downsizing has slowed from year ago. While some industries, including computer, have seen an increase in job cuts, most of last year’s leading job-cut industries have experienced a decline. And, as we approach the midway point of the year, we do not expect a second-half surge in downsizing unless there is a sudden and severe shock to the economy,” said Challenger.
“Several recent reports suggest continued growth in the coming months. Factory orders increased for the third consecutive month in April and automakers are reporting strong sales. On Tuesday, a report indicated that small businesses saw its strongest hiring push in more than a year, as these firms added 35,000 workers to their payrolls. That nearly triples the average 12,000 workers added per month since April 2010.
“Moreover, the latest report on metropolitan area unemployment from the Bureau of Labor Statistics shows that there are now 118 metro areas with unemployment rates below 5.0 percent. All of this bodes well for the nation’s job seekers,” said Challenger.
The Bureau of Labor Statistics press release released on Friday June 6th reads as follows:
The Employment Situation —May 2014
Total non-farm payroll employment rose by 217,000 in May, and the unemployment rate was unchanged at 6.3 percent. Employment increased in professional and business services, health care and social assistance, food services and drinking places, and transportation and warehousing. Over the prior 12 months, non-farm payroll employment growth had averaged 197,000 per month.
Professional and business services added 55,000 jobs in May, the same as its average monthly job gain over the prior 12 months. In May, this industry added 7,000 jobs each in computer systems design and related services and in management and technical consulting. Employment in temporary help services continued to trend up (+14,000) and has grown by 224,000 over the past year.
In May, health care and social assistance added 55,000 jobs. The health care industry added 34,000 jobs over the month, twice its average monthly gain for the prior 12 months. Within health care, employment rose in May by 23,000 in ambulatory health care services (which includes offices of physicians, outpatient care centers, and home health care services) and by 7,000 in hospitals. Employment rose by 21,000 in social assistance, compared with an average gain of 7,000 per month over the prior 12 months.
Within leisure and hospitality, employment in food services and drinking places continued to grow, increasing by 32,000 in May and by 311,000 over the past year.
Transportation and warehousing employment rose by 16,000 in May. Over the prior 12 months, the industry had added an average of 9,000 jobs per month. In May, employment growth occurred in support activities for transportation (+6,000) and couriers and messengers (+4,000).
Manufacturing employment changed little over the month but has added 105,000 jobs over the past year. Within this industry, durable goods added 17,000 jobs in May and has accounted for the net job gain in manufacturing over the past 12 months.
Employment in other major industries, including mining and logging, construction, wholesale trade, retail trade, information, financial activities, and government, showed little change over the month.
The average workweek for all employees on private non-farm payrolls was unchanged at 34.5 hours in May. The manufacturing workweek increased by 0.2 hour in May to 41.1 hours, and factory overtime was unchanged at 3.5 hours. The average workweek for production and non-supervisory employees on private non-farm payrolls was unchanged at 33.7 hours.
In May, average hourly earnings for all employees on private nonfarm payrolls rose by 5 cents to $24.38. Over the past 12 months, average hourly earnings have risen by 2.1 percent. In May, average hourly earnings of private-sector production and non-supervisory employees increased by 3 cents to $20.54.
After revision, the change in total non-farm employment for March remained +203,000, and the change for April was revised from +288,000 to +282,000. With these revisions, employment gains in March and April were 6,000 lower than previously reported.
SMU Comment: The recovery in total non-farm employment is now looking stronger than the 2004 to 2007 time frame but we are disappointed in the underlying numbers. There are two factors to this issue. These are the total number employed and the quality of those jobs which translates to total disposable income. The US economy continues to transform in the direction of service industries in preference to goods producing and many of the service jobs are low income. The growth of construction jobs though sustained since early 2011 is slower than in any other recovery since 1980, (Figure 4), and manufacturing is making slow progress in recovering the jobs lost since the recession. Good news is that government employment is down 0.2 percent in the last 24 months.


