Analysis

May 2, 2014
Construction Expenditures through March 2014
Written by Peter Wright
Each month the Commerce Department issues its construction put in place (CPIP) data on the first working day covering activity two months earlier. March data was released on May 1st.
Total Construction
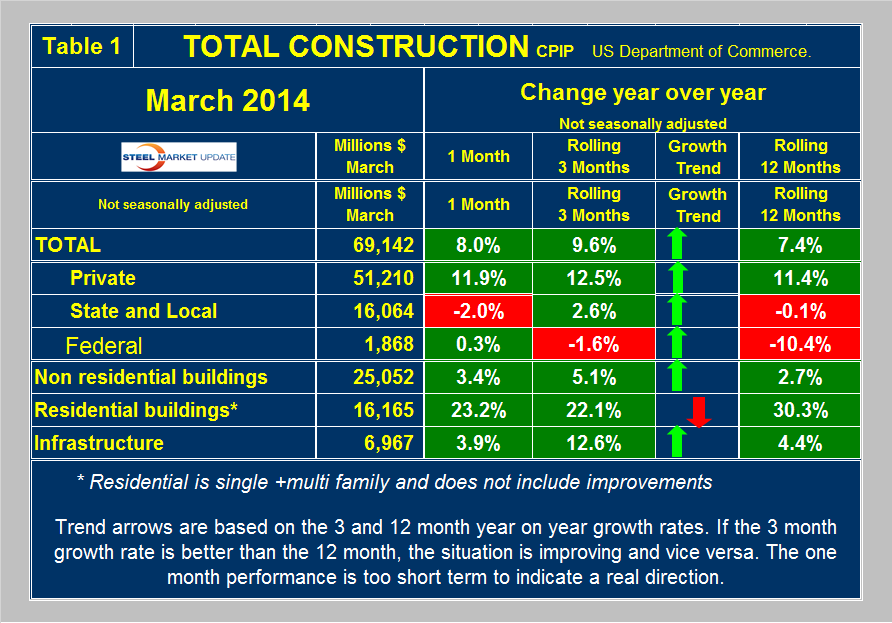
March expenditures were $69.142 billion which breaks down to $51.210 B of private work, $16.064 B state and locally financed and $1.868 B of Federal expenditures (Table 1).
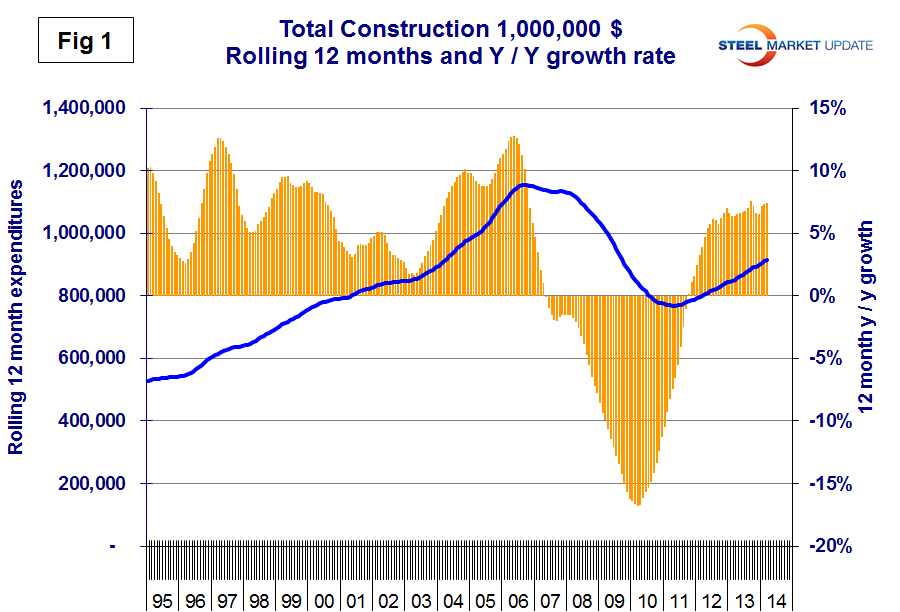
Federal expenditures picked up slightly in March y / y but long term are declining rapidly as Washington struggles with its deficit. The Federal sector is so small as to be of little interest to us as we review the big picture. On a rolling three month basis total construction was up by 9.6 percent year over year (y/y) and was up by 7.4 percent on a rolling 12 months y/y. This means that total construction growth is accelerating since the short term growth (3 months) is greater than the long term, (12 months). Note this is not a seasonal effect because our y / y analysis removes seasonality. Both private and state and local work have positive momentum. We consider three sectors within total construction. These are non-residential, residential and infrastructure. On a rolling three month basis y/y non-residential is growing at 5.1 percent and accelerating. Residential is growing at 22.1 percent and slowing. Infrastructure grew 12.6 percent y/y in the last three months showing rapid acceleration. All numbers quoted in this analysis are not seasonally adjusted. The growth of total construction has been fairly steady for over 18 months but it will be 2018 before the pre recessionary peak is regained (Figure 1).
Private Construction
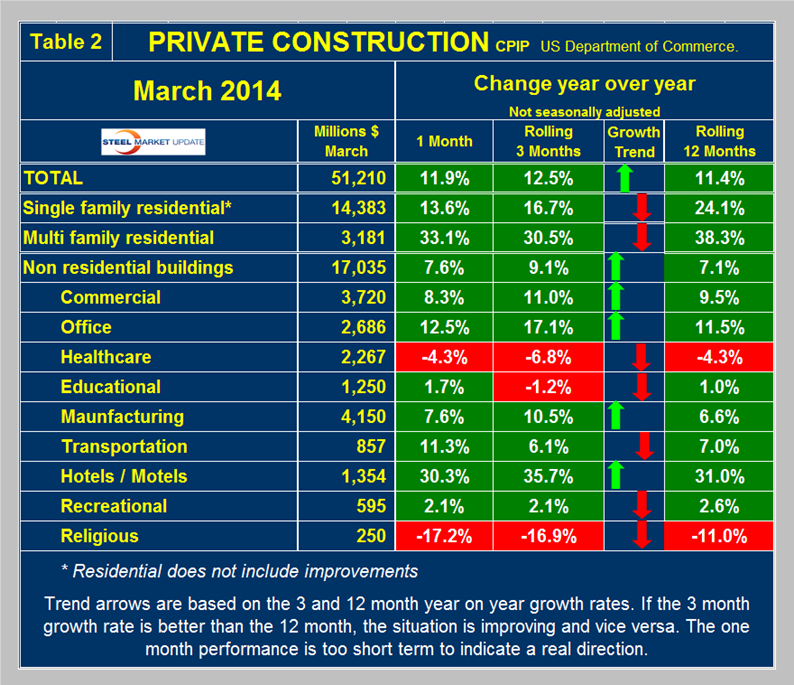
Private work accelerated slightly from an 11.4 percent growth rate in 12 months y/y to a 12.5 percent rate in 3 months y/y (Table 2).
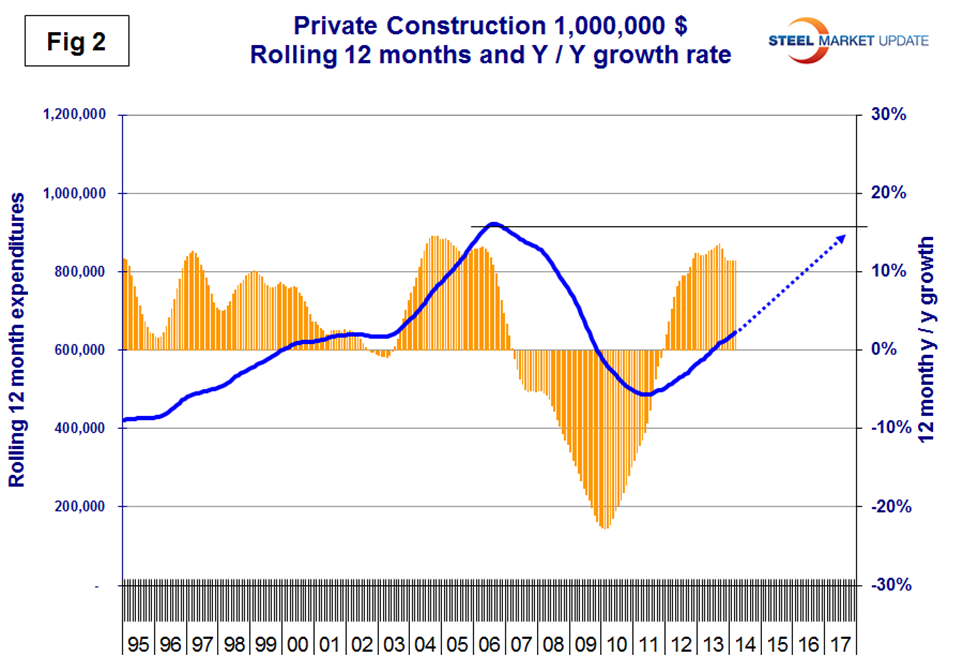
The growth of private work has exceeded 10 percent for the last 19 months but at the current rate it will be mid 2017 before recovery is complete (Figure 2). Table 2 breaks down the private sector into project types. Residential buildings, both single and multi-family are growing rapidly though slowing. This data coincides well with the housing starts data that SMU reports every month. Private non-residential buildings are growing at a 9.1 percent rate and accelerating. Within private non-residential, only health care and religious buildings are showing a sustained contraction. In the other hand hotels / motels are showing surprising strength and accelerating and office construction is doing well.
State and Local Construction
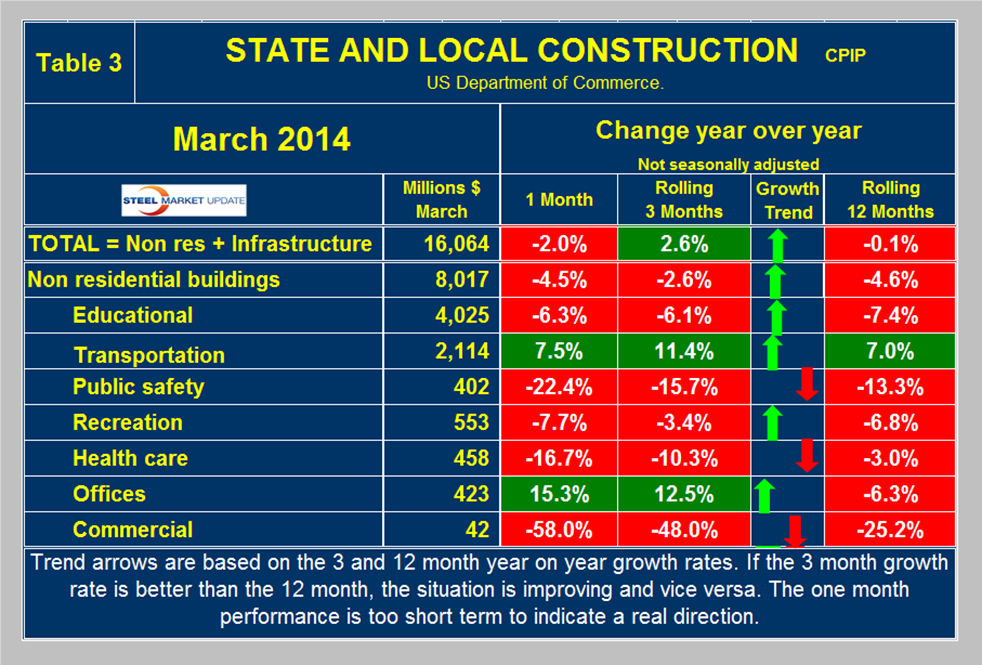
S&L work declined in the single month of March y / y but the 3MMA increased by 2.6 percent (Table 3).
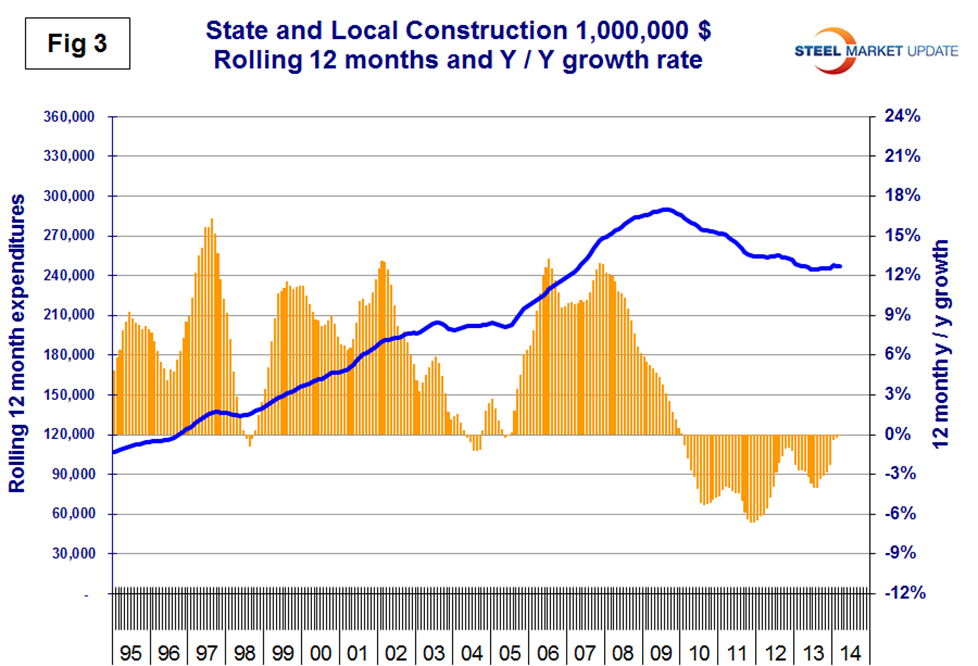
Overall state and local construction expenditures appear to have bottomed out (Figure 3) however this is entirely due to the infrastructure sector, see below. S&L non-residential building contracted 2.6 percent in three months through March y/y, but the contraction is slowing. Educational buildings are by far the largest sub sector of S&L non-residential at $4 billion in March but contraction continues with no end in sight. Transportation terminals are doing extremely well with a 3 month growth rate of 11.4 percent and a very strong March. State fiscal balances are improving as income and sales tax revenues recover and property values / taxes increase. However many state and local governments are far from healthy, as increased revenues have been more than offset by increased future obligations, including the need to replenish reserve and rainy-day funds and to service defined benefit liabilities, pensions foremost. Therefore, there is little room for increased public spending on all but the most essential categories. Considering the financial weakness of many sub-national governments, it will be years before public construction catches up to pre-recession totals.
Drilling down into the private and S&L sectors as presented in Tables 2 and 3 shows which project types should be targeted for steel sales and which should be avoided. There are some project types within S&L that are doing quite well.
Infrastructure
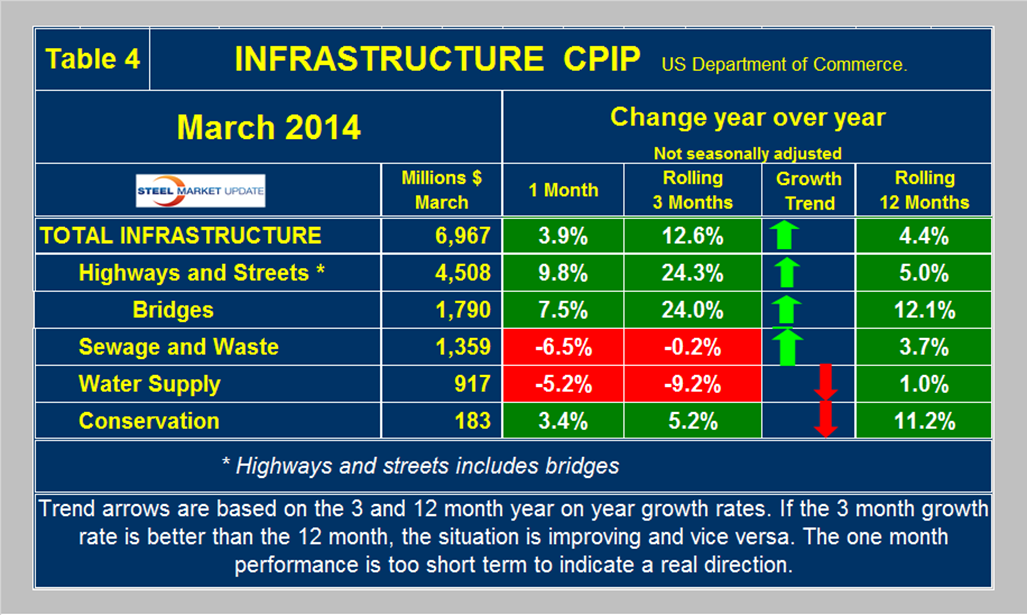
Highway and streets construction which includes bridges grew at the surprisingly strong rate of 24.3 percent in the three months through March y / y showing positive momentum from the 12 month growth rate of 5.0 percent (Table 4).
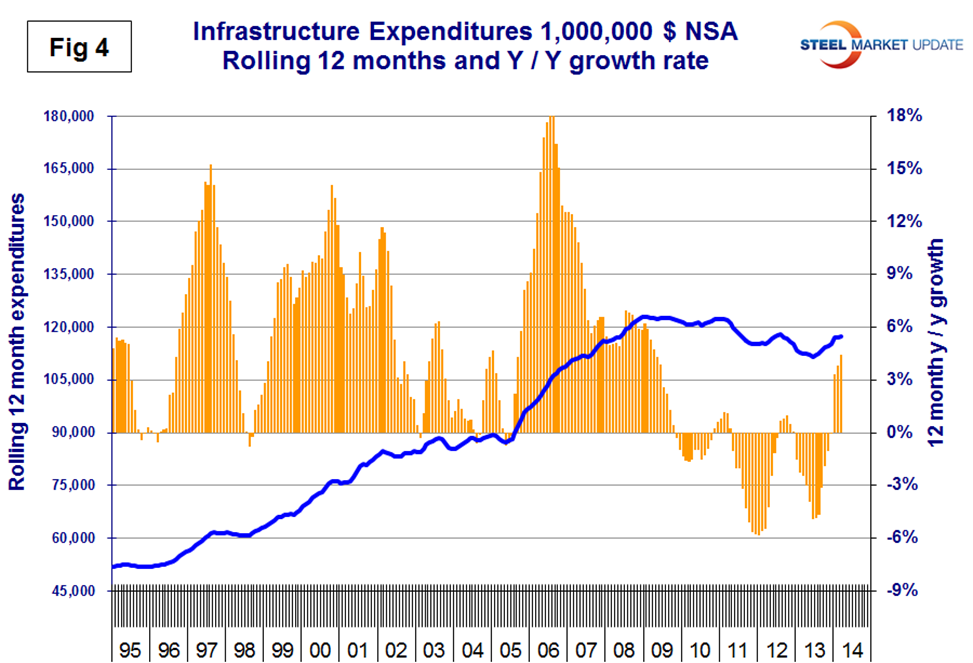
The only sectors that slowed in three months through March were water supply and sewage and waste. Based on the Commerce Department CPIP reports the state of infrastructure expenditures is not as bad as the press would have us believe. At the present rate of growth, infrastructure expenditures will reach the pre-recessionary level sometime in 2015 (Figure 4). This is far from the case with S&L residential and non-residential construction.
Overall we at SMU conclude that private construction will continue to show strong growth until some presently unforeseen event de-rails it. State and local non-residential building will muddle through with only the most critical projects being undertaken. The wild card is infrastructure expenditures, particularly highways and streets. The highway trust fund will be exhausted in Q3 2014. The following is an update from The Hill, transportation blog published April 29th.
President Obama on Tuesday sent Congress a legislative proposal for $302 billion in federal transportation funding in a bid to spur a broader debate about how best to pay for the nation’s infrastructure. Obama’s plan has virtually no chance of being enacted, because it relies heavily on revenue from a corporate tax reform proposal that is strongly opposed by Republicans. But Transportation Secretary Anthony Foxx said the new legislation, which the administration has dubbed the “Grow America Act,” could jumpstart a conversation about how to avoid the looming bankruptcy in the trust fund that pays for transportation projects. The fund could run dry as early as August. “Failing to act before the Highway Trust Fund runs out is unacceptable — and unaffordable,” Foxx said in a statement. “This proposal offers the kind of job creation and certainty that the American people want and deserve.” The president’s proposal calls for a four-year extension of funding for federal road and transit funding before it expires in September. The plan would authorize $75.5 billion in annual spending, which would be a $20 billion increase over current yearly funding levels. It would also close the $66 billion shortfall in the Highway Trust Fund. The president is proposing to pay for the spending by generating some $150 billion in revenue from corporate tax reform — something Congress is unlikely to consider. Republican leaders in the House have signaled that even a tax reform plan from one of their own members,
House Ways and Means Committee Chairman Dave Camp (R-Mich.), is a non-starter.
Transportation advocates in Washington praised the administration for drafting a “concrete” funding proposal, even though the plan does not adopt an increase in the gas tax that has been pushed by the U.S. Chamber of Commerce and major labor unions.
Transportation advocates have clamored for a new transportation bill that lasts longer than the two years authorized in the Moving Ahead for Progress in the 21st Century (MAP-21) Act, which Congress passed in 2012. They say a longer-term bill is needed to give state and local governments more certainty when planning out infrastructure projects. These people have pushed for an increase in the gas tax to a rate that would nearly double the amount of extra money drivers are charged at the pump, to 33 cents per gallon. Supporters say the increase would make up for the revenue that has been lost during a 20-year stagnation in the gas tax.


