Market Data

May 1, 2014
Global Economic Outlook
Written by Peter Wright
The following article published April 13, is one that we would normally just provide to our Premium Level members. We thought that those who have Executive level and Monthly membership would be interested in some of the detail we are providing our Premium Level members. If you have questions about Premium Level membership please feel free to contact our offices: 800-432-3475 or by email: info@SteelMarketUpdate.com
Global Economic Outlook. IMF April 2014.
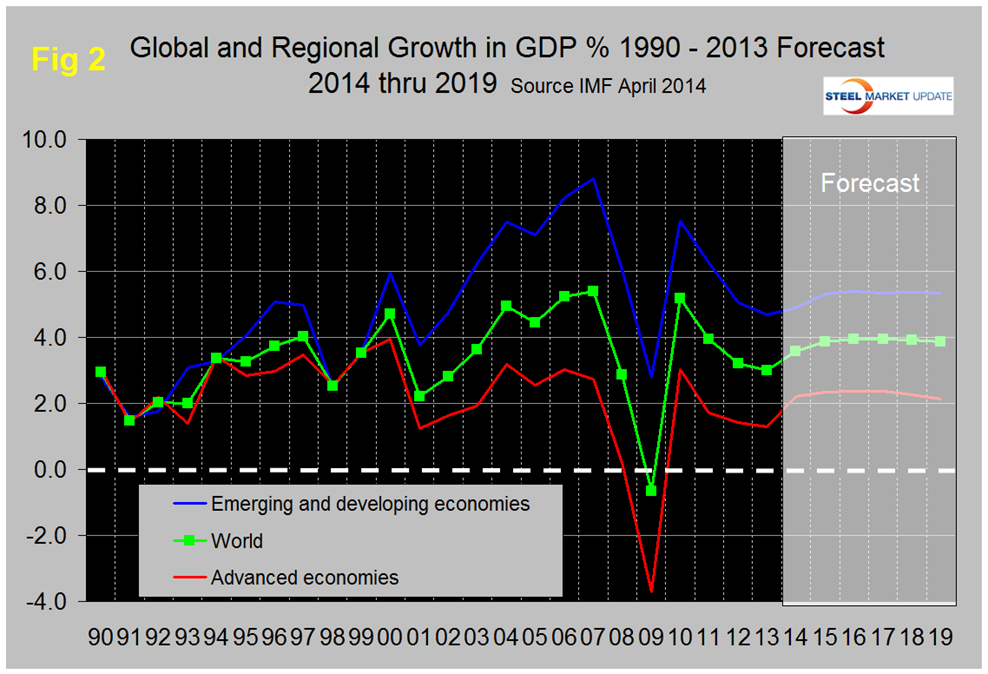
Last week the IMF revised its forecast for global / regional and national GDP growth through 2019. The new forecast calls for an expansion of global GDP from 3.0 percent in 2013 to 3.6 percent in 2014 and stabilizing at around 3.9 percent in the years 2015 through 2019.
Figure 1 shows the history and forecast of Global GDP from 1970 through 2019. The “grey hairs” among our readers will have recognized the similarity between the years 1974 / 75 and 2008 / 09 when sustained global expansion in the 5 percent range led to an extreme commodity bubble / bust which is still reverberating in our businesses. The IMF forecast through 2019 shows no sign of such a return and if history repeats itself we should be safe until 2043!
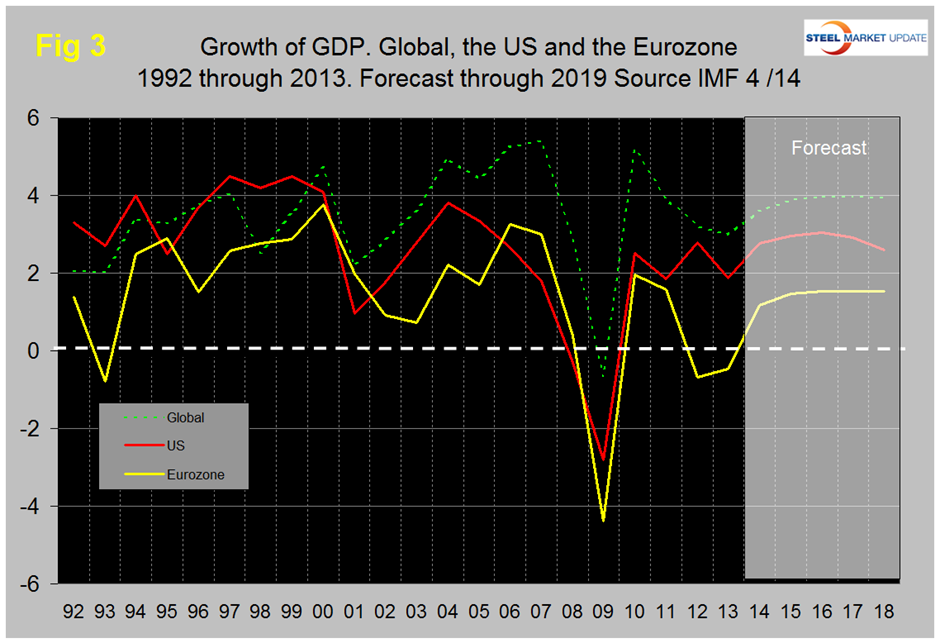
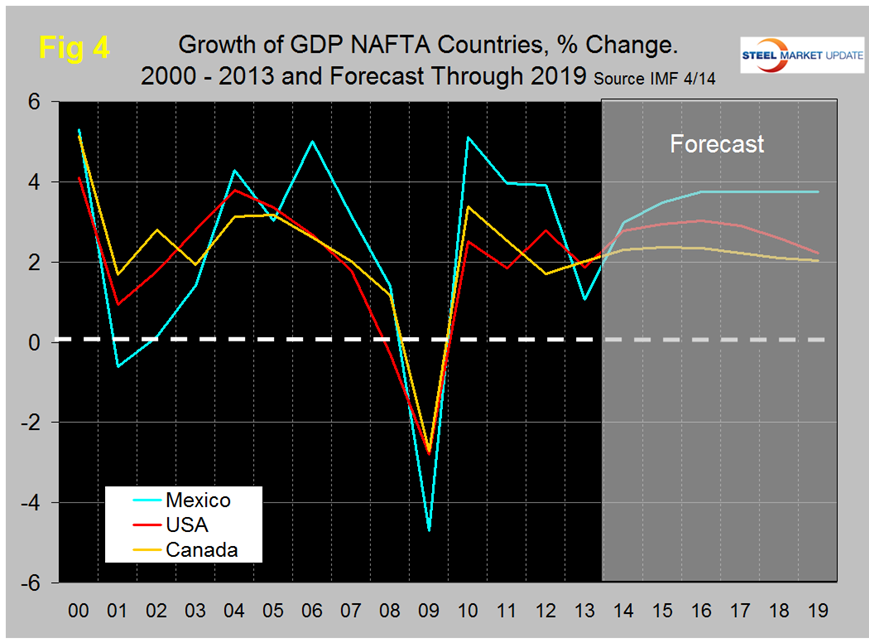
The IMF forecast calls for a 2.8 percent growth in the US economy this year rising to 3.03 percent in 2016 and declining to 2.2 percent in 2019. The developing world will not see a return to the blistering growth that they enjoyed before the recession, (Figure 2), the US will continue to outperform the Eurozone, (Figure 3), and Mexico which had the lowest growth rate in NAFTA last year will take the lead again this year, (Figure 4).
There is a relationship between the growth of GDP and steel demand at both the international and national level which also extends to other commodities such as cement. There are two interesting aspects to this relationship. First, the cyclical change in steel demand is vastly more volatile than the change in GDP which we attribute to the inventory response throughout the supply chain.
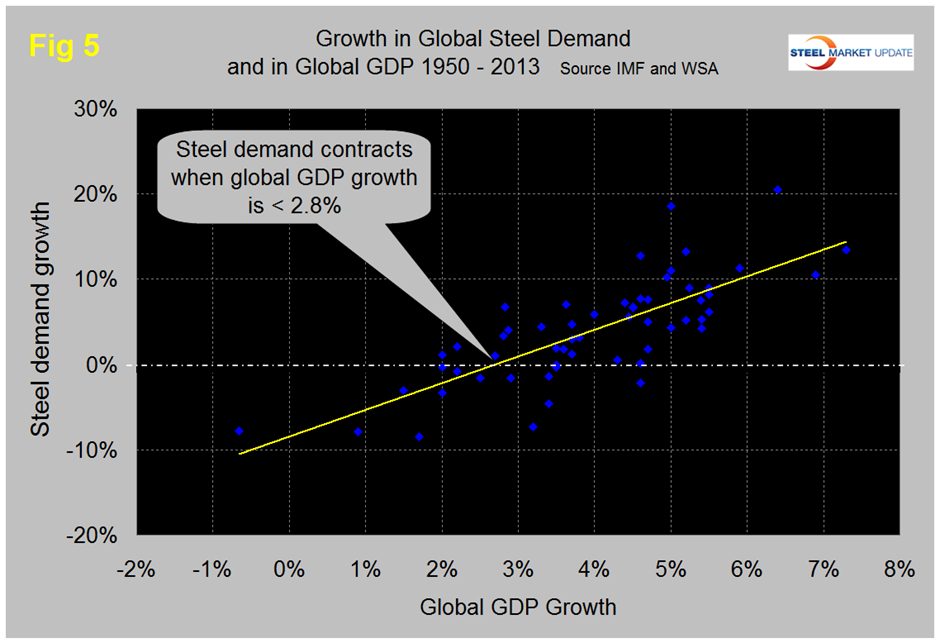
Secondly, as discovered by our friends at “Steel Guru” is that 1 percent growth in GDP does not result in 1 percent growth in steel demand. At the global level it takes a 2.8 percent increase in GDP to get any increase in steel demand (Figure 5). This is a long term average over a period of 64 years and based on the added volatility of steel can be a predictor of the immediate future. For example, after the disastrous decline in steel demand in 2009 there was no doubt that a huge cyclical rebound would occur as inventory managers throughout the world began to react to the economic recovery. If the IMF forecast proves to be correct then the growth in steel demand through 2019 will settle in close to the yellow line in Figure 5 with a growth in steel demand of about 3.5 percent per year. We confess we haven’t yet figured out why the growth of steel and the economy don’t cross at zero but it does appear to be a fact that is born out in our examination of the US steel and cement markets and also by the steel market in Thailand for which we happened to have some data. In the US steel market it requires about 2 percent growth in GDP to generate growth in steel demand therefore again if current forecasts prove to be correct regarding the US economy we can expect the steel market to expand through 2019. This recovery in the US should exceed the long term average as construction digs its way out and manufacturing re-shores to the US.
There is a serious issue regarding the effect of the tapering of the Fed’s asset purchase program on the economies of developing nations and by extension and reflection on the growth of US exports and the US economy. What follows here is a discourse by John Mauldin and the Transcript of the International Monetary and Financial Committee (IMFC) Press Briefing both presented on Saturday April 12th 2014.
At SMU we believe that the details included here and our understanding are essential for long term management of our steel businesses.
The QE-Induced Bubble Boom in Emerging Markets by John Mauldin April 12th:
“By trying to shore up their rich-world economies with unconventional policies such as ultra-low rate targets, outright balance sheet expansion, and aggressive forward guidance, major central banks have distorted international real interest rate differentials and forced savers to seek out higher (and far riskier) returns for more than five years. This initiative has fueled enormous overinvestment and capital misallocation – and not just in advanced economies like the United States.
As it turns out, the biggest QE-induced imbalances may be in emerging markets, where, even in the face of deteriorating fundamentals, accumulated capital inflows (excluding China) have nearly DOUBLED, from roughly $5 trillion in 2009 to nearly $10 trillion today. After such a dramatic rise in developed-world portfolio allocations and direct lending to emerging markets, developed-world investors now hold roughly one-third of all emerging-market stocks by market capitalization and also about one-third of all outstanding emerging-market bonds. The Fed might as well have aimed its big bazooka right at the emerging world. That’s where a lot of the easy money ran blindly in search of more attractive real interest rates, bolstered by a broadly accepted growth story.
The conventional wisdom – a particularly powerful narrative that became commonplace in the media – suggested that emerging markets were, for the first time in a long time, less risky than developed markets, despite their having displayed much higher volatility throughout the past several decades. As a general rule, people believed emerging markets had much lower levels of government debt, much stronger prospects for consumption-led growth, and far more favorable demographics. (They overlooked the fact that crises in the 1980s and 1990s still limited EM borrowing limits until 2009 and ignored the fact that EM consumption is a derivative of demand and investment from the developed world.) Instead of holding traditional safe-haven bonds like US treasuries or German bunds, some strategists even suggested that emerging-market government bonds could be the new safe haven in the event of major sovereign debt crises in the developed world. And better yet, it was suggested that denominating these investments in local currencies would provide extra returns over time as EM currencies appreciated against their developed-market peers.
Sadly, the conventional wisdom about emerging markets and their currencies was dead wrong. Herd money (typically momentum-based, yield-chasing investors) usually chases growth that has already happened and almost always overstays its welcome. This is the same disappointing boom/bust dynamic that happened in Latin America in the early 1980s and Southeast Asia in the mid-1990s. And this time, it seems the spillover from extreme monetary accommodation in advanced countries has allowed public and private borrowers to leverage well past their natural carrying capacity.
The lesson is always the same, and it is hard to avoid. Economic miracles are almost always too good to be true. Whether we’re talking about the Italian miracle of the ’50s, the Latin American miracle of the ’80s, the Asian Tiger miracles of the ’90s, or the housing boom in the developed world (the US, Ireland, Spain, et al.) in the ’00s, they all have two things in common: construction (building booms, etc.) and excessive leverage. Broad-based, debt-fueled overinvestment may appear to kick economic growth into overdrive for a while; but eventually disappointing returns and consequent selling lead to investment losses, defaults, and banking panics. And, in cases where foreign capital seeking strong growth in already highly valued assets drives the investment boom, the miracle often ends with capital flight and currency collapse.
Economists call that dynamic of inflow-induced booms followed by outflow-induced currency crises a “balance of payments cycle,” and it tends to occur in three distinct phases.
In the first phase, an economic boom attracts foreign capital, which generally flows toward productive uses and reaps attractive returns from an appreciating currency and rising asset prices. In turn, those profits fuel a self-reinforcing cycle of foreign capital inflows, rising asset prices, and a strengthening currency.
In the second phase, the allure of promising recent returns morphs into a growth story and attracts ever-stronger capital inflows – even as the boom begins to fade and the strong currency starts to drag on competitiveness. Capital piles into unproductive uses and fuels over-investment, over-consumption, or both; so that ever more inefficient economic growth increasingly depends on foreign capital inflows. Eventually, the system becomes so unstable that anything from signs of weak earnings growth to an unanticipated rate hike somewhere else in the world can trigger a shift in sentiment and precipitous capital flight.
In the third and final phase, capital flight drives a self-reinforcing cycle of falling asset prices, deteriorating fundamentals, and currency depreciation… which invites more even more capital flight. If this stage is allowed to play out naturally, the currency can fall well below the level required to regain competitiveness, sparking run-away inflation and wrecking the economy as asset prices crash.
In order to avoid that worst-case scenario, central bankers often choose to spend their FX reserves or to substantially raise domestic interest rates to defend the currency. Although it comes at great cost to domestic growth, this kind of intervention often helps to stem the outflows… but it cannot correct the core imbalances. The same destructive cycle of capital flight, falling asset prices, falling growth, and currency depreciation can restart without warning and trigger – even years after a close call – an outright currency collapse if the central bank runs out of policy tools.
That worst case is the looming risk for many emerging markets today, particularly in the externally leveraged “Fragile Five”: Brazil, India, Turkey, Indonesia, and South Africa. Together they account for more than $3.3 trillion of the total $10 trillion of developed-country assets currently invested in emerging markets. Not only have those countries amassed a disproportionate share of total inflows to emerging markets, each has its own insidious combination of structural and political obstacles to long-term growth. And their own central banks are seriously constrained in the run-up to national elections between now and October 2014. After a brief reprieve from taper-induced capital flight, the most externally leveraged emerging economies have had some time to breathe easy; but the crisis is far from over. This one, as all such booms and busts do, will end in tears.
Although countries like India and Indonesia have taken positive steps toward reducing their external imbalances, real reforms take time; and balance-of-payments episodes will recur until the core imbalances have been resolved.
A sudden rise in real interest rates abroad – which could arise purely from a miscue in FOMC forward guidance – could slam a long list of emerging markets simply by reducing the real risk premium over “safe” assets. Even a 200-basis-point move in US rates could create a strong incentive for less productive capital in compromised or overvalued markets to rush for the exits in headlong capital flight. It may sound like an extreme case, but even a moderate rise in real interest rates abroad would be enough to trigger disorderly and destructive currency adjustments across the emerging world.”
Transcript of the International Monetary and Financial Committee (IMFC) Press Briefing Saturday April 12th 2014:
Tharman Shanmugaratnam, IMFC Chairman: “I thought it would be useful for me to give you a sense of some of the key themes in our discussions. Some of them are reflected in the communiqué, of course, but I would like to give some emphasis to some important themes.
First, as a very general point, we felt that we need a new balance in policies that meets the needs of the new phase in the economic recovery globally. What do I mean by a new balance? It is a focus on the medium term more than the short term, and a much greater focus on structural reforms.
Now, this does not mean a sudden withdrawal of macroeconomic policies, especially monetary policies, that support the recovery, but it does mean a much greater focus on structural reforms: balance sheet repair in banking systems, including in Europe; improving the functioning of labor markets so as to reduce the extraordinarily high levels of youth unemployment in many parts of the world; and building up institutions not just in emerging or developing countries but strengthening institutions in advanced economies as well. So, we spent a lot of time discussing structural reforms over the course of the last two days.
A second area of focus had to do with financial stability. There was much greater concern about not just the legacy risks coming out of the last crisis but about new financial risks; the increase in corporate leverage in some parts of the world, developing and some of the advanced economies, not matched by improvements in investment, not matched by growth of investment, but just increased leverage – more debt relative to assets.
There was also the continued risk of volatility in capital flows to emerging market economies. That is not going to be a short-term phenomenon but a continuing challenge, partly reflecting – and the staff’s work on this has been very useful, if you look at the Global Financial Stability Report, for instance – partly reflecting a change in the structure of global finance, with larger capital flows and also a changed composition.
We have greater share of capital flows thorough bond markets, and a greater share that has been taken by mutual funds and ETFs, often reflecting retail investors at the other end who tend to be more easily jittery. What we have observed is more herd-like behavior in the markets, more herd-like capital flows, which means risk on/risk off is now a more accentuated phenomenon. So, that is a continuing risk.
The third area of risk that we were concerned about was the geopolitical. That does not need much elaboration. The Fund plays an important role in that regard, being quick to respond, to stabilize economic situations where possible.”


