

Analysis

April 21, 2014
Oil and Gas Prices and Rotary Rig Counts
Written by Peter Wright
This month (April 2014) the EIA (U.S. Energy Information Administration) released its report on petroleum reserves for 2012. Proved reserves are estimated volumes of hydrocarbon resources that analysis of geologic and engineering data demonstrates with reasonable certainty are recoverable under existing economic and operating conditions. Reserves estimates change from year to year as new discoveries are made, existing fields are more thoroughly appraised, existing reserves are produced, and prices and technologies change.
Discoveries include new fields, identification of new reservoirs in previously discovered fields, and extensions, which are additions to reserves that result from additional drilling and exploration in previously discovered reservoirs. Within a given year, extensions are typically the largest percentage of total discoveries. While discoveries of new fields and reservoirs are important indicators of new resources, they generally account for a small portion of overall annual reserve additions.
SMU Note: proven reserves are a function of price:
The EIA goes on to say; In 2012, oil and gas exploration and production companies operating in the United States added 4.5 billion barrels of crude oil and lease condensate proved reserves, an increase of 15.4 percent from 2011—the largest annual increase since 1970. U.S. proved reserves of crude oil and lease condensate have now risen for four consecutive years. Also, proved reserves of oil exceeded 33.4 billion barrels for the first time since 1976. Proved reserves of U.S. wet natural gas decreased 7.5 percent (a loss of 26 trillion cubic feet) to 323 trillion cubic feet in 2012. Total discoveries of oil and natural gas proved reserves both exceeded U.S. production in 2012, with the largest discoveries occurring onshore within the Lower 48 states. The 2012 decline interrupted a 14-year trend of consecutive increases in natural gas proved reserves. U.S. proved reserves of natural gas declined in 2012 because of low natural gas prices. The average reference price of natural gas companies use to estimate reserves declined 34 percent between 2011 and 2012. Natural gas prices began to decline in the latter part of 2011 and continued to drop through spring 2012. This prompted large downward net revisions of 45.6 trillion cubic feet to the proved reserves of existing gas fields — enough to cancel out almost all the gains from total discoveries in 2012. The average price of oil, on the other hand, remained relatively constant in 2012 at an average daily spot price of $95 per barrel, and as a result, net revisions added almost a billion barrels of crude oil and lease condensate proved reserves
Fast forward to April 2014.
Figure 1 shows historical gas and oil prices since January 2000. The price of oil has been fairly stable by historical standards for over three years though in the second half of that time frame has been drifting up. West Texas Intermediate closed at 104.05 on April 11th. The price of gas on the other hand has dropped by 26 percent in the last month to $4.63/MM Cu Feet delivered the Henry Hub Louisiana. Evidently the February/March spike was a weather event and as we reported last month, “Working natural gas in storage decreased to 1,443 Bcf as of Friday, February 14, according to the EIA Weekly Natural Gas Storage Report. A net storage withdrawal of 250 Bcf for the week resulted in storage levels 40 percent below year-ago levels and 34 percent below the 5-year average.”
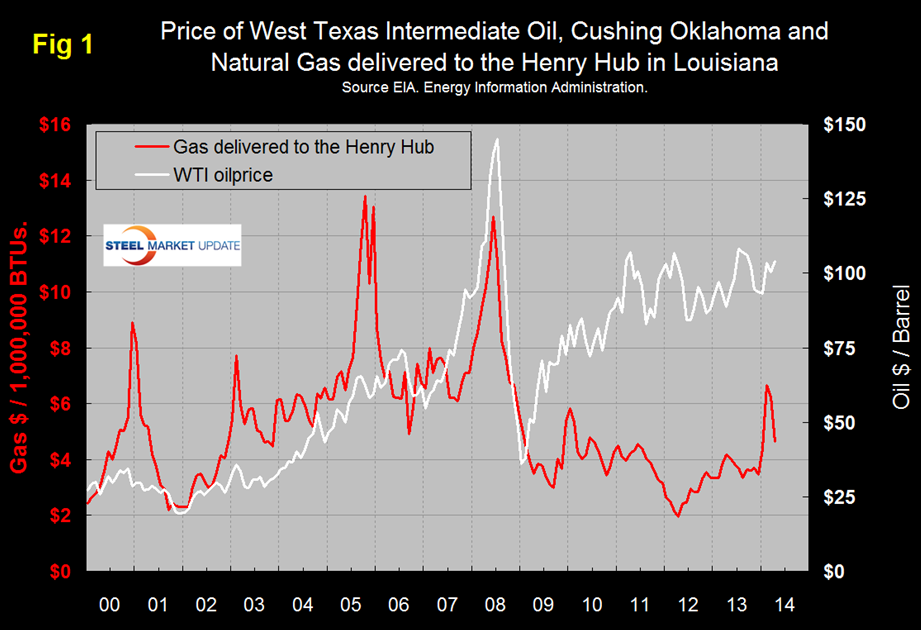
Figure 2 shows the Baker Hughes North American Rotary Rig Count which is a weekly census of the number of drilling rigs actively exploring for or developing oil or natural gas in the United States and Canada. Rigs are considered active from the time they break ground until the time they reach their target depth and may be establishing a new well or sidetracking an existing one. The Baker Hughes Rotary Rig count includes only those rigs that are significant consumers of oilfield services and supplies. Fig 2 shows that the oil rig count which had been trending flat for almost two years has now taken off again and is now at the highest level in over 2 ½ decades. The gas rig count is still trending down and is currently 80.3 percent below the peak of September 2008.
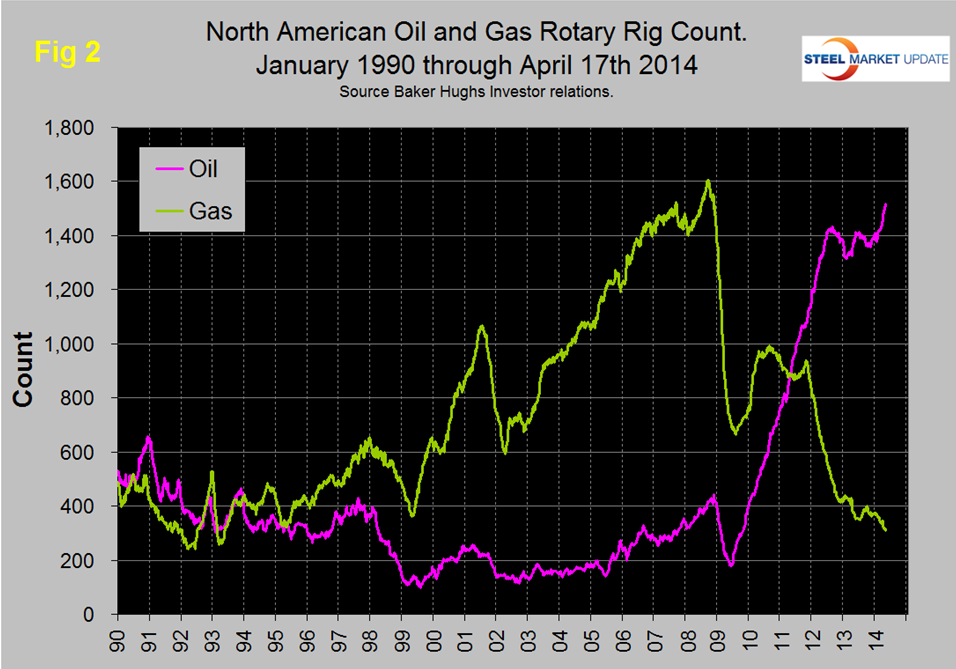
The total number of operating rigs is now 1831, an increase of 28 in the last month. Land rigs increased by 31 in this time frame and off shore decreased by 3. On a regional basis the big three states for operating rigs are Texas at 882, Oklahoma at 187 and North Dakota at 178. In the last month, rigs operating in Texas have increased by 28 meaning that changes in all other states were more or less a wash. Off shore drilling has recovered from the Deep Water Horizon oil spill in 2010 but is still not back to where it was at the beginning of the last decade.
The evolution of the North American energy market is good news for future steel demand. We believe that market trends for natural gas will eventually result in more production. These include higher domestic demand for such industries as direct reduced iron amongst many others. Also the restrictions on LNG exports are likely to be relaxed in the face of the situation in Ukraine.