Analysis

April 16, 2014
March Housing Permits and Starts
Written by Peter Wright
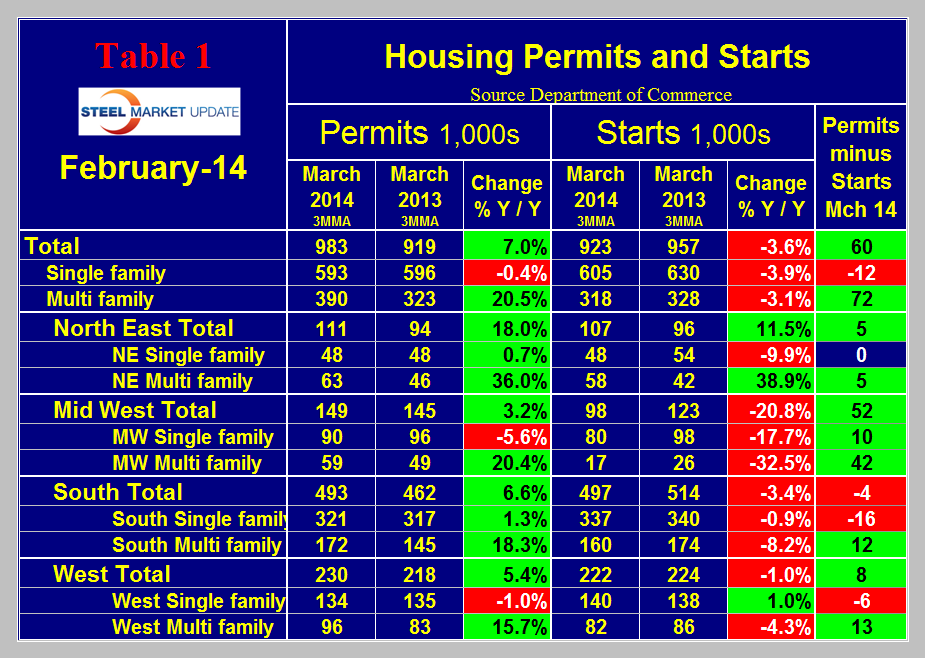
We were somewhat in disbelief when we analyzed the March housing data this week but on checking the formulas in our spread sheets it appears that our first impression was correct. Table 1 shows building permits and housing starts data for Q1 2014 compared to Q1 2013. Total construction starts were down by 3.6 percent year over year but what really surprised us was that multifamily (apartment) starts also declined. This was the first year over year contraction for apartment starts since May 2010 which was the end of the recessionary contraction. The Mid-west was the worst affected but even the West and the South experienced a contraction in multifamily starts.
H.A.R.D.I in their quarterly trends report made the following observation: “Housing starts are in a firm Phase C, Slower Growth, trend which started long before the cold winter set in. In fact, the numbers out of the West and South (less impacted by the frigid 2014 winter) are also softening, suggesting there is more at play in the housing market than a couple colder-than-normal months. For HARDI Members that move with the housing market, there are clear signals that 2014 growth is not going to be as strong as 2013.”
Searching for some good news in the data reveals that permits for apartments exceeded starts by 60,000, almost all of which was in the Midwest, however, permits for single family were below starts suggesting no immediate recovery for this sector.
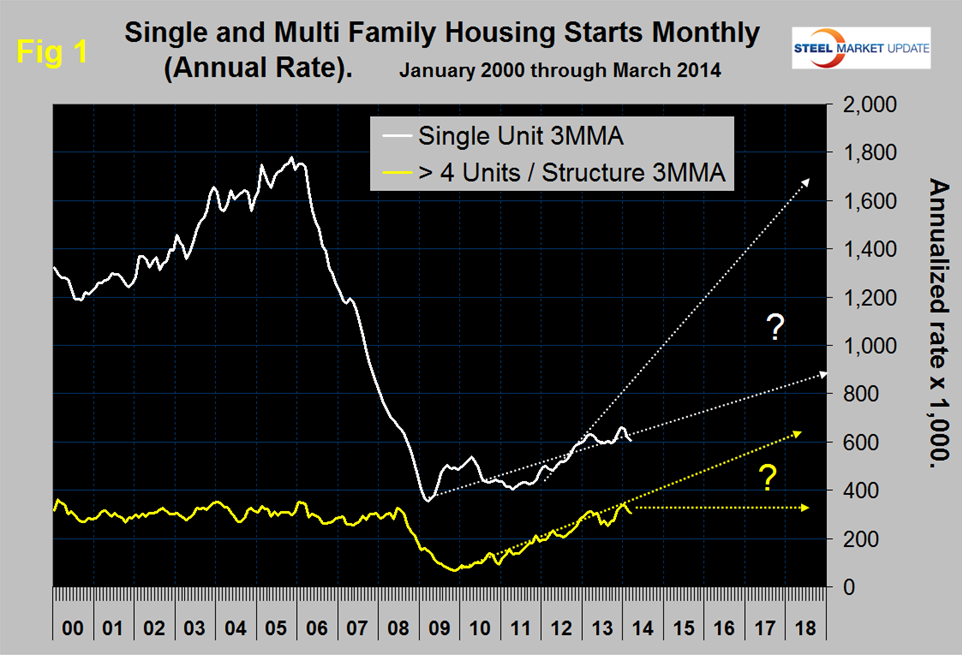
Figure 1 attempts unsuccessfully to project the volume of starts into the future but the direction is very unclear. No doubt weather played a part this last winter but we will have to wait a couple more months to evaluate the magnitude of that effect.
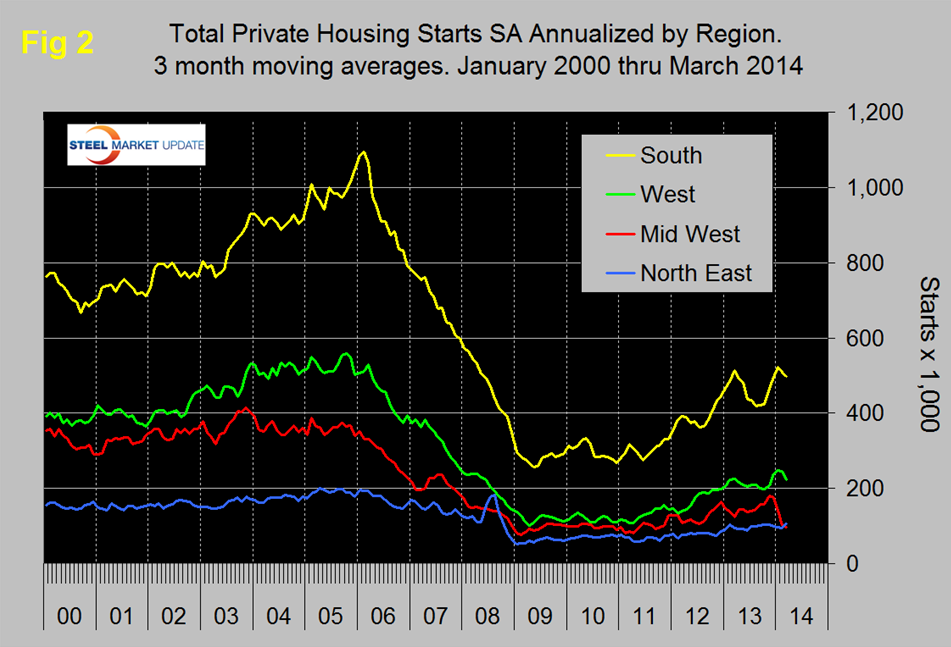
Figure 2 analyzes total starts on a regional basis and shows the extent of the Mid-west effect but also the declines in the South and the West. Mortgage rates are in a holding pattern. The 30-year fixed rate of 4.34 percent is virtually unchanged from rates nine months ago. Even at these rates, demand for mortgages appears to be waning. Existing Home Saleshave been running below the year-ago level since November. H.A.R.D.I’s forecast is for flat-to-mildly-falling interest rates. Beyond 12 months, they expect rising rates for several years to come as rates revert back to long-term historical averages.
RealtyTrac released its February 2014 Residential & Foreclosure Sales Report on March 27th, showing that U.S. residential properties, including single family homes, condominiums and town homes, sold at an estimated annual pace of 5,083,241 in February, a 0.2 percent decrease from the previous month but still up 7 percent from a year ago February marked the fourth consecutive month where sales activity has decreased on a monthly basis. The decrease in sales volume nationwide was driven by monthly decreases in 31 states. Meanwhile sales volume decreased on a year-over-year basis in six states, including Massachusetts, California, Arizona and Nevada, and 21 of the nation’s 50 largest metro areas, including seven California markets along with Phoenix, Orlando, Las Vegas and Detroit, among others.
“Supply and demand have reached a bit of a standoff in this uneven real estate recovery,” said Daren Blomquist, vice president at RealtyTrac. “The supply of distressed properties — which buyers and investors have come to rely on over the past few years — is evaporating quickly in most markets, but that dwindling supply is not being adequately replenished by non-distressed homeowners listing their homes or by new homes being built. Meanwhile, a key source of demand over the past two years — institutional investors purchasing single family homes as rentals — is starting to decline, and it’s not yet clear if that diminishing demand will be filled by first-time home buyers and move-up buyers.” Short sales and distressed sales — in foreclosure or bank-owned — accounted for 16.9 percent of all U.S. sales in February, up from 16.1 percent of sales in January but down from 19.1 percent of sales in February 2013.
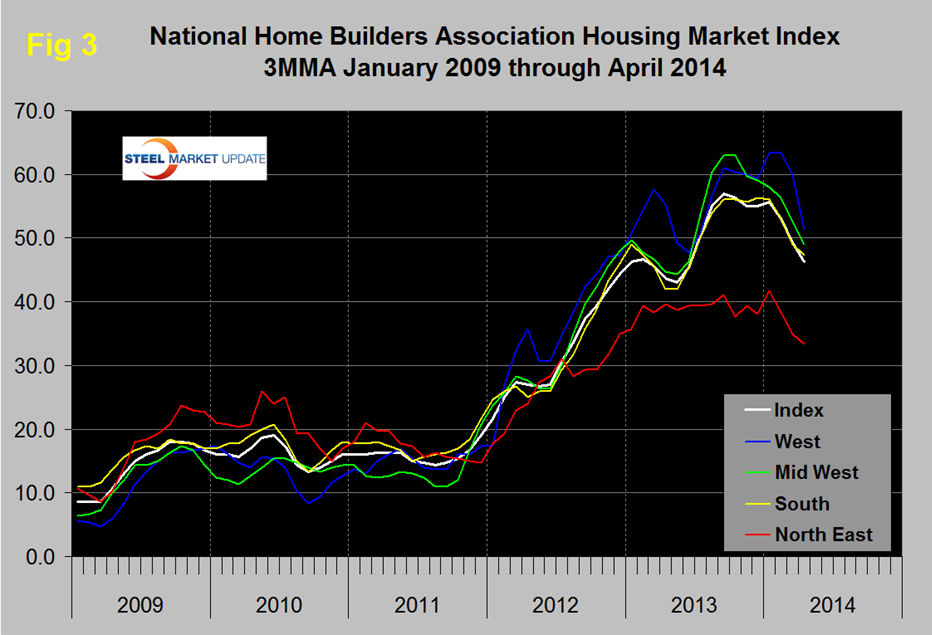
The National Home Builders Association released their builder’s confidence data for March this week. The national index rose one point to 47 in April. A value below 50 indicates that more builders regard the market as unfavorable than favorable. On a three month moving average basis builder confidence has been declining across all regions for all of this year, (Figure 3). In its release, the NAHB mentions that two key headwinds inhibiting homebuilder confidence are tight credit for homebuyers and a limited availability of labor.
Why do we as steel people care? Because housing is a leading indicator of many construction sectors such as non-residential and sub sectors of infrastructure. Housing density and volume significantly affects the consumption of many steel products from rebar to structurals to galvanized sheet.


