Analysis

March 19, 2014
Housing Starts and Permits in February 2014
Written by Peter Wright
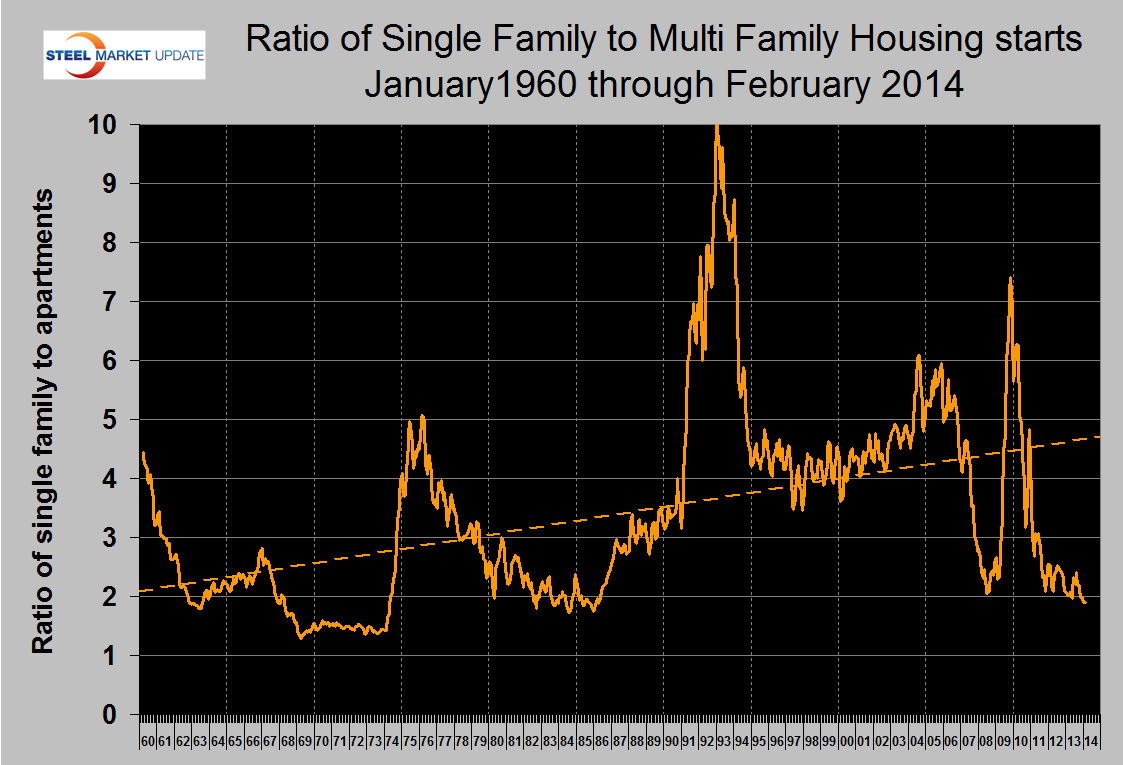
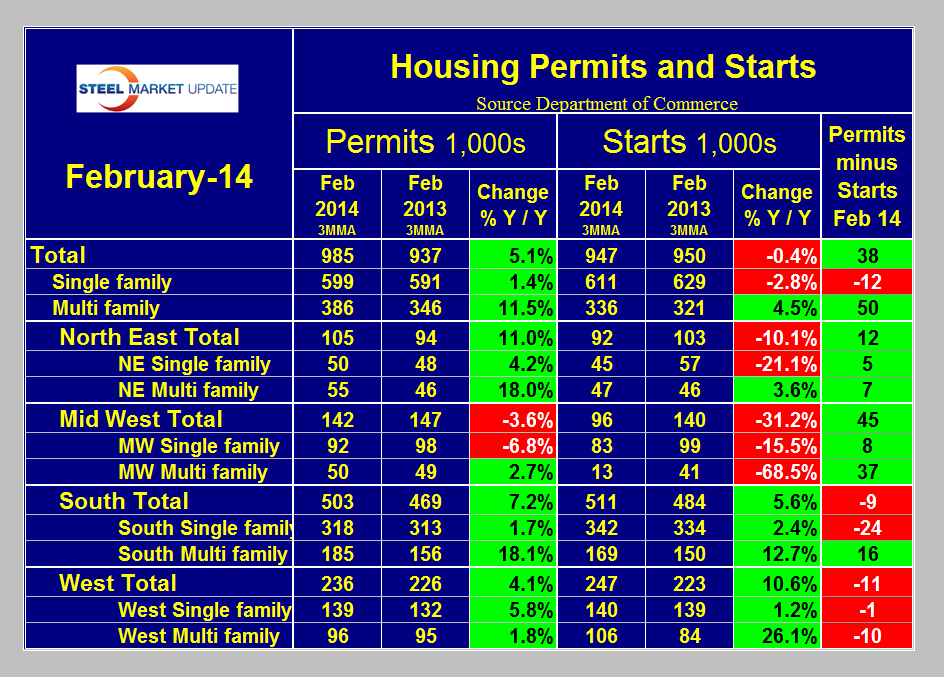
In February total building permits exceeded total starts by 38,000 units which would seem at first glance to be a good sign. However digging down into the data reveals a much more complex situation in this market. The two sub sectors, single and multi-family units are behaving differently. Single family permits were 12,000 less than starts, suggesting a slowing in this sub sector as multifamily permits exceeded starts by 50,000 units suggesting an acceleration of apartment construction. In February on a three month moving average (3MMA) basis the ratio of single family to multifamily starts fell below 2 for the first time since June 1986 (Figure 1). This ratio is now well below the long term trend line and is falling indicating a medium term shift that will likely not recover in this decade.
Why do we as steel people care? Because housing is a leading indicator of many construction sectors such as non-residential and sub sectors of infrastructure. Housing density and volume significantly affects the consumption of many steel products from rebar to structurals to galvanized sheet.
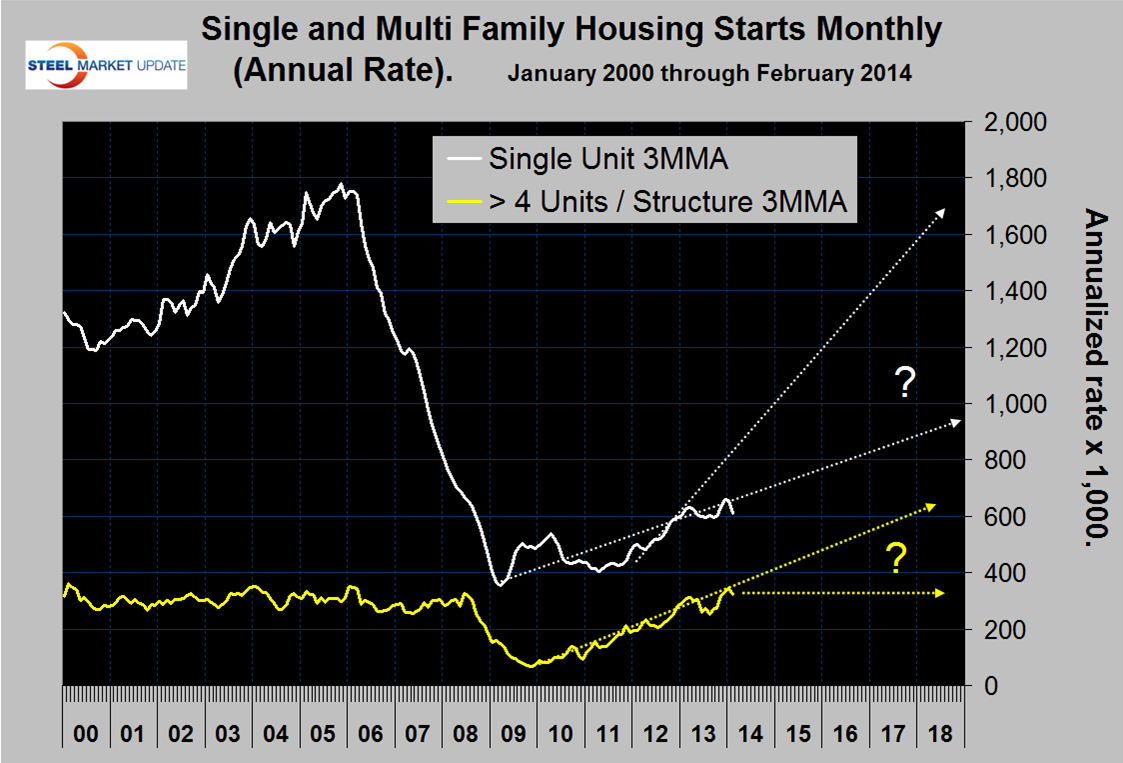
The 3MMA of both single and multifamily starts declined in February. No doubt the inclement weather played a part in this change but taking a long term view it is not clear where housing is headed. If the trend of single family starts regains the trajectory that existed in 2012 then a recovery to the pre-recession peak will occur in 2018 but if the trend is projected back in time to the beginning of the recovery the previous peak will not be regained for a very long time (Figure 2). The trend of multifamily units is also not clear because this sector has already exceeded the pre-recession peak. Since it is clear that the ratio of single to multifamily will not return to its long term trend any time soon, it can be expected that positive growth and steel consumption by this sector will continue for years.
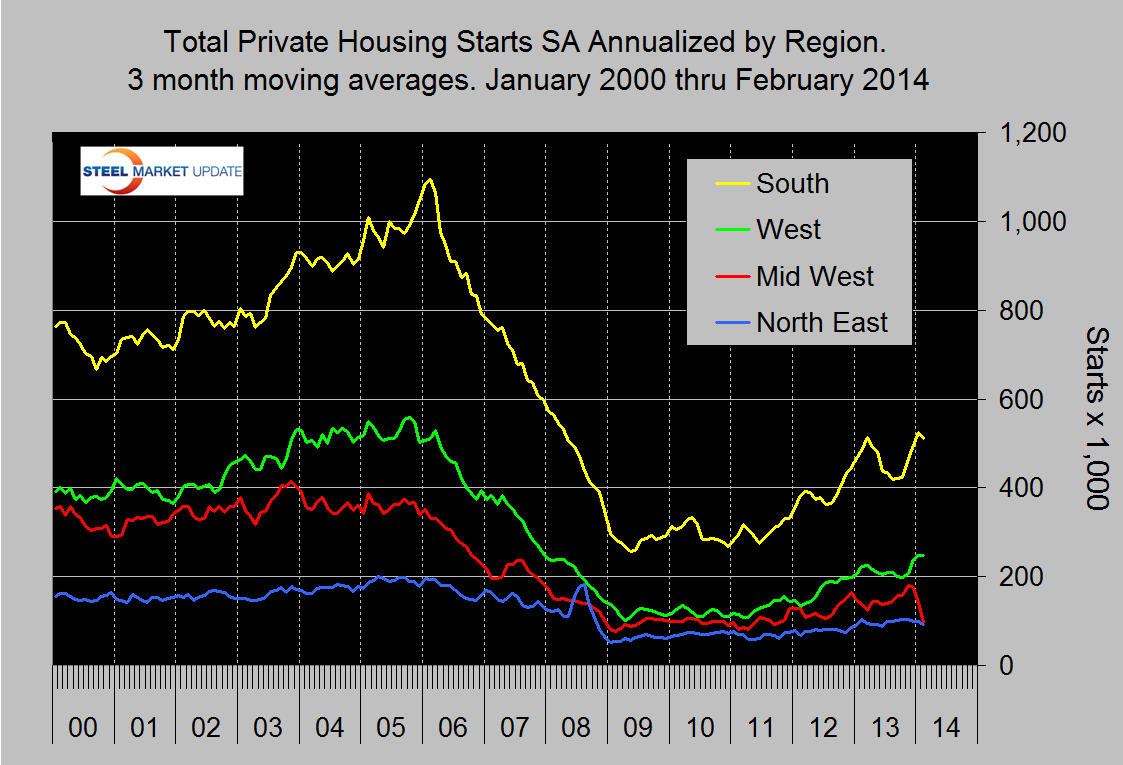
There is a large regional variation in housing performance. The Mid-West has suffered the worst but the South and West have also seen a decline this year (Figure 3). Again weather must be a factor but single family permits in the Mid-West also declined year over year which is not a good sign. On a 3MMA basis the West led in year over year growth at 10.6 percent followed by the South at 5.6 percent (Table 1).
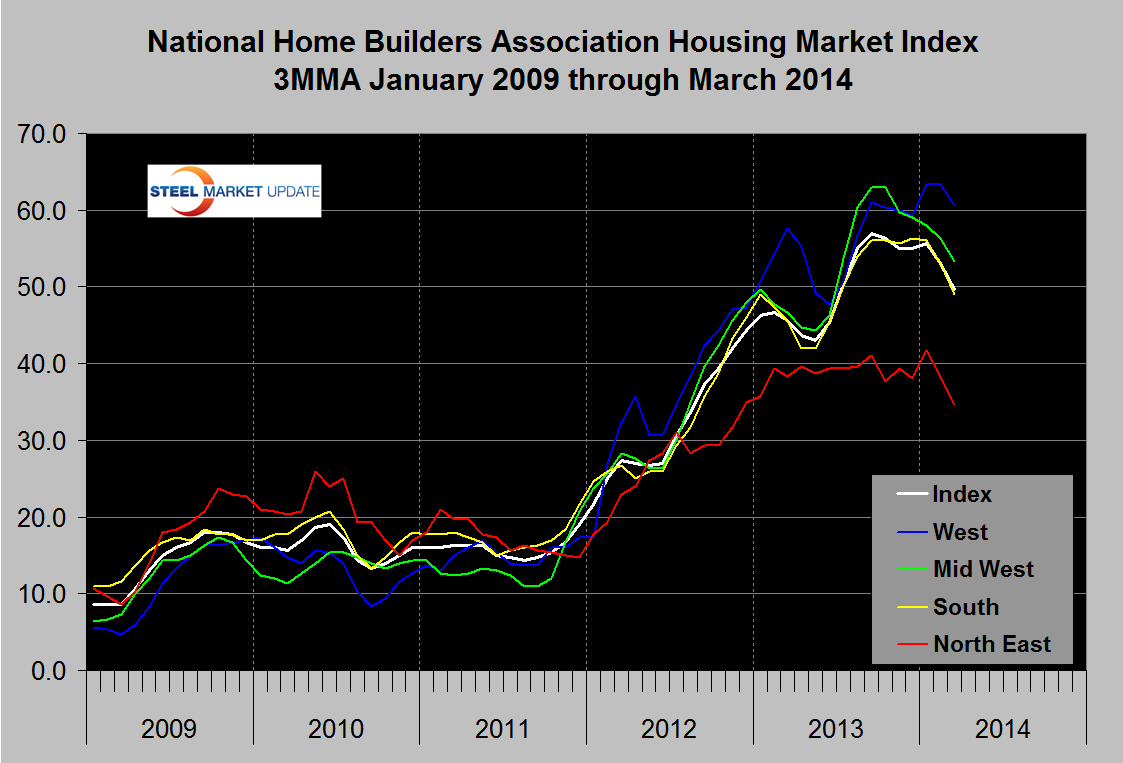
The National Association of Home Builders released their regional and national confidence index data for February last week. A value >50 indicates that more builders consider the market favorable than un-favorable. The 3MMA of national sentiment fell from 53 in February to 49.7 in March which was the first month <50 since June last year (Figure 4). Sentiment in the North East is weakest and in the West the strongest. Rising materials prices and shortages of skilled workers are partly to blame for reduced builder confidence.
Moody’s Economy.com reports as follows: “Weak single-family housing demand also appears to be problematic. On a 12-week moving average basis, the Mortgage Bankers Association’s purchase mortgage application index is hovering around 174, a level consistent with purchase activity in 1997. Consequently, the MBA has measurably adjusted down its purchase originations forecast. As of December, the association was anticipating purchase originations, in dollar terms, to rise by nearly 9 percent in 2014. However, the latest forecast shows an increase of about 2 percent. The main concern for single-family housing demand is weak financial conditions among potential first-time homebuyers. According to the latest existing-home sales report by the National Association of Realtors, first-time homebuyers constitute about 25 percent to 30 percent of total existing-home transactions; historically, they average about 40 percent. Many of these households have limited or no exposure to the run-up in stock prices and by definition are not benefiting from a rise in house prices. Stronger income growth will be the key to unleashing potential demand from many of these younger households. However, on a six-month moving average year-over-year basis, wages and salaries are advancing at just under 3 percent, a meager rate relative to the current pace of job growth. Consequently, real per capita disposable income was essentially unchanged over the course of 2013. Though many obstacles lurk, the low inventory of homes coupled with stronger job and income growth should ignite residential construction. As long as increases in mortgage interest rates are consistent with economic growth, potential homebuyers should be able to absorb higher rates. This strengthening demand for homes in an environment of low new-home supplies will encourage homebuilders to construct more homes, generating all of the positive downstream effects that accompany construction jobs.”
Foreclosure activity dropped in February to its lowest level in more than seven years as shown by RealtyTrac data. A total of 112,498 foreclosure filings (default notices, scheduled auctions, and bank repossessions) were recorded during the month. That’s the lowest level since December 2006. In an encouraging sign that the housing market continues to recover, the majority of states saw a decline in foreclosure starts (which are typically measured by default notices). A total of 51,842 properties began the foreclosure process in February. That’s the lowest level since December 2005, well before the housing market crashed. Foreclosure starts are an important harbinger of the market, because they catch potential foreclosures at the earliest possible point. February’s foreclosure starts come in 9 percent lower than January’s level, 27 percent lower than one year earlier.