Analysis

March 4, 2014
Construction Expenditures through January 2014
Written by Peter Wright
We are producing two articles on construction expenditures this evening. The one below is written by Peter Wright and delves into a much deeper analysis than our previous article. This is one of our Premium Level articles and gives you an idea of some of the content we share with our Premium Level members.
Each month the Commerce Department issues its construction put in place (CPIP) data on the first working day covering activity two months earlier. January data was released on March 3rd.
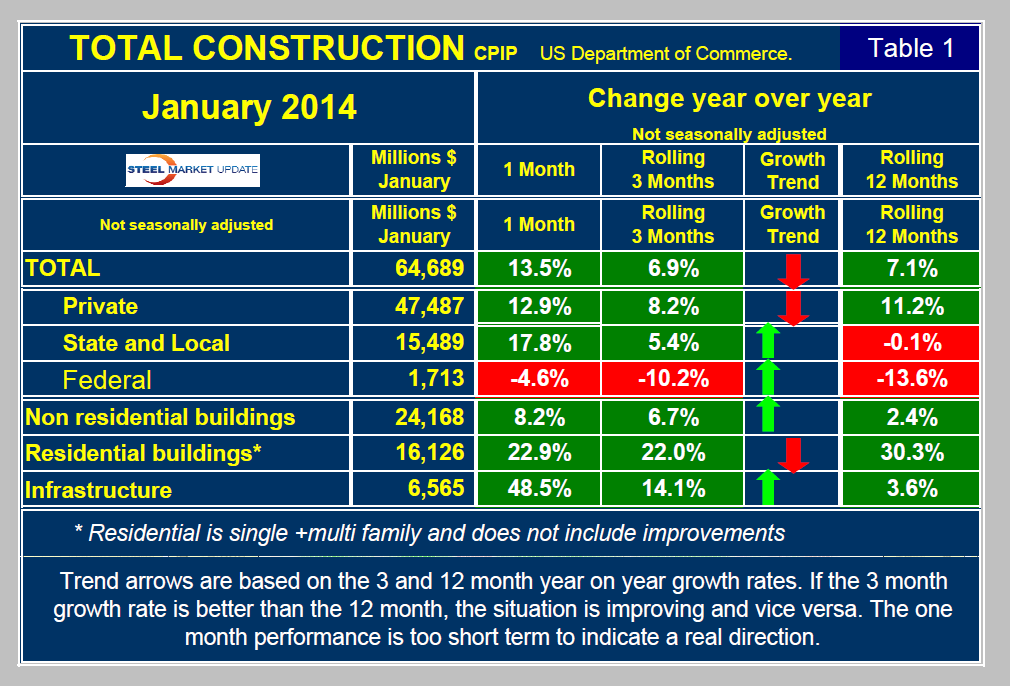
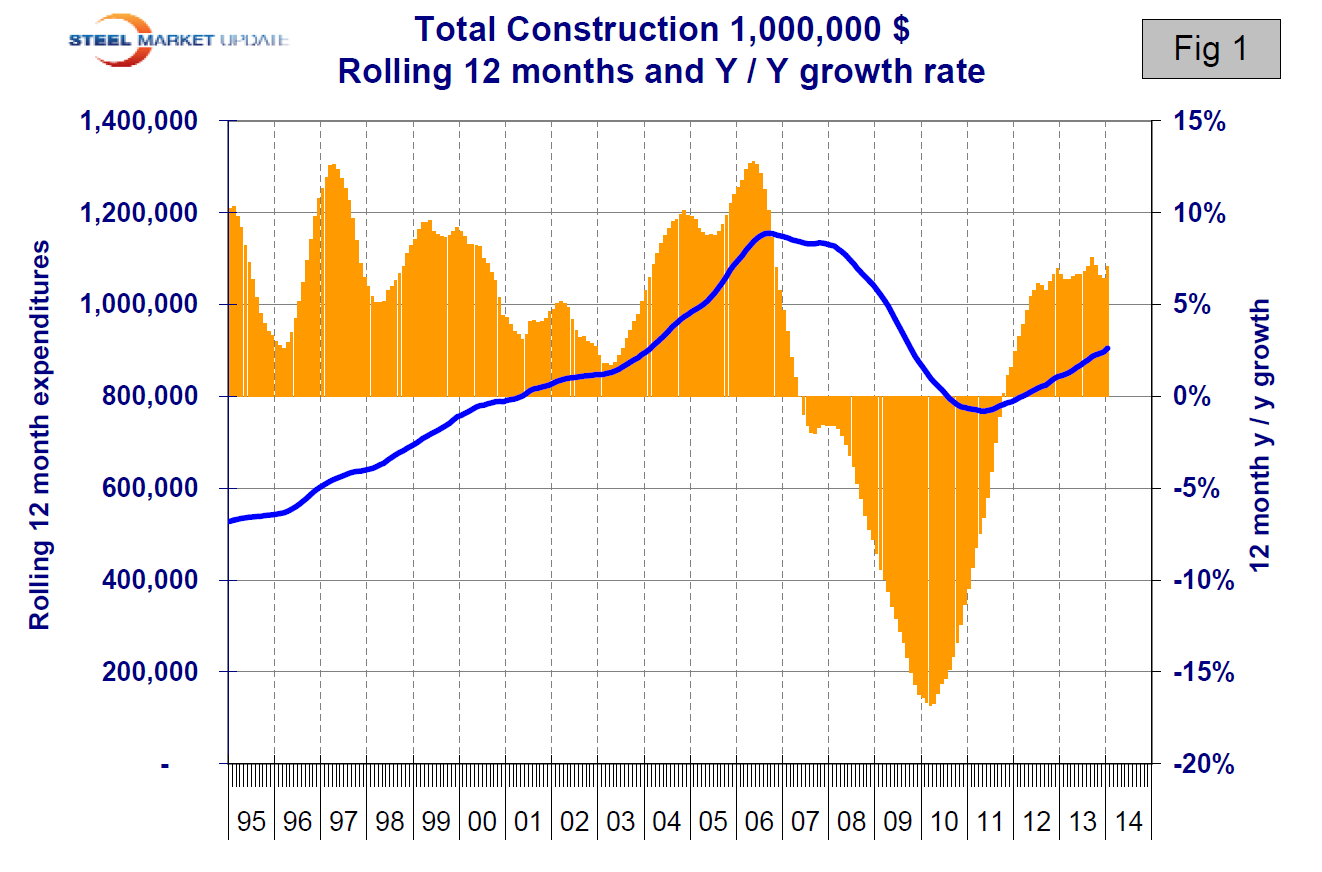 Total Construction: January expenditures were $64.689 billion which breaks down to $47.487 billion of private work, 15.489 billion state and locally financed and $1.743 billion of federal expenditures (Table 1). Federal expenditures are declining rapidly as Washington struggles with its deficit but this construction sector is so small as to be of little interest. On a rolling three month basis total construction was up by 6.7 percent year over year (y/y) and was up by 7.1 percent on a rolling 12 months y/y. This means that total construction growth was essentially flat since the short term growth (3 months) was very similar to the long term, (12 months). This is not true of private and state and local (S&L) work. We consider three sectors within total construction. These are non residential, residential and infrastructure. On a rolling three month basis y/y non residential is growing at 8.4 percent and accelerating. Residential is growing at 22.0 percent and slowing. Infrastructure grew 13.0 percent y/y in the last three months showing rapid acceleration. All numbers quoted in this analysis are not seasonally adjusted. Construction is highly seasonal and for our purposes we always compare data year over year to eliminate this effect. The growth of total construction has been fairly steady for over 18 months but it will be 2018 before the pre-recessionary peak is regained (Figure 1).
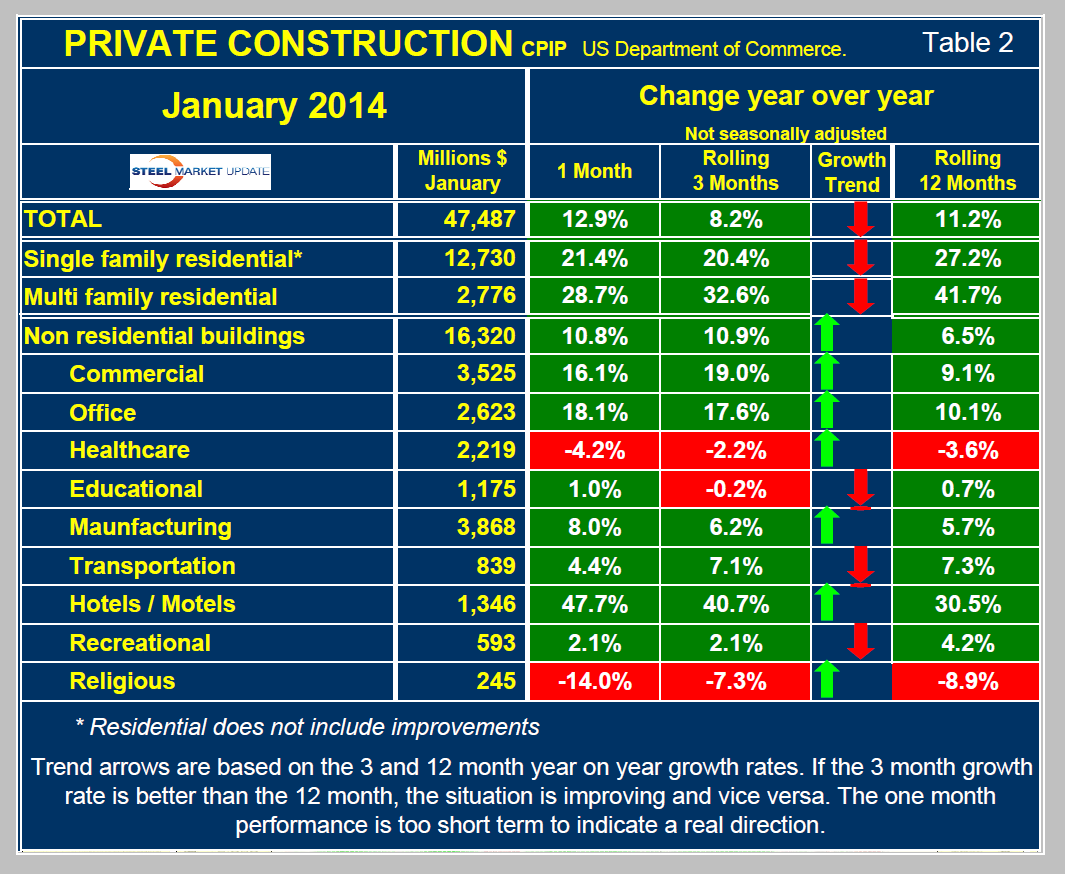
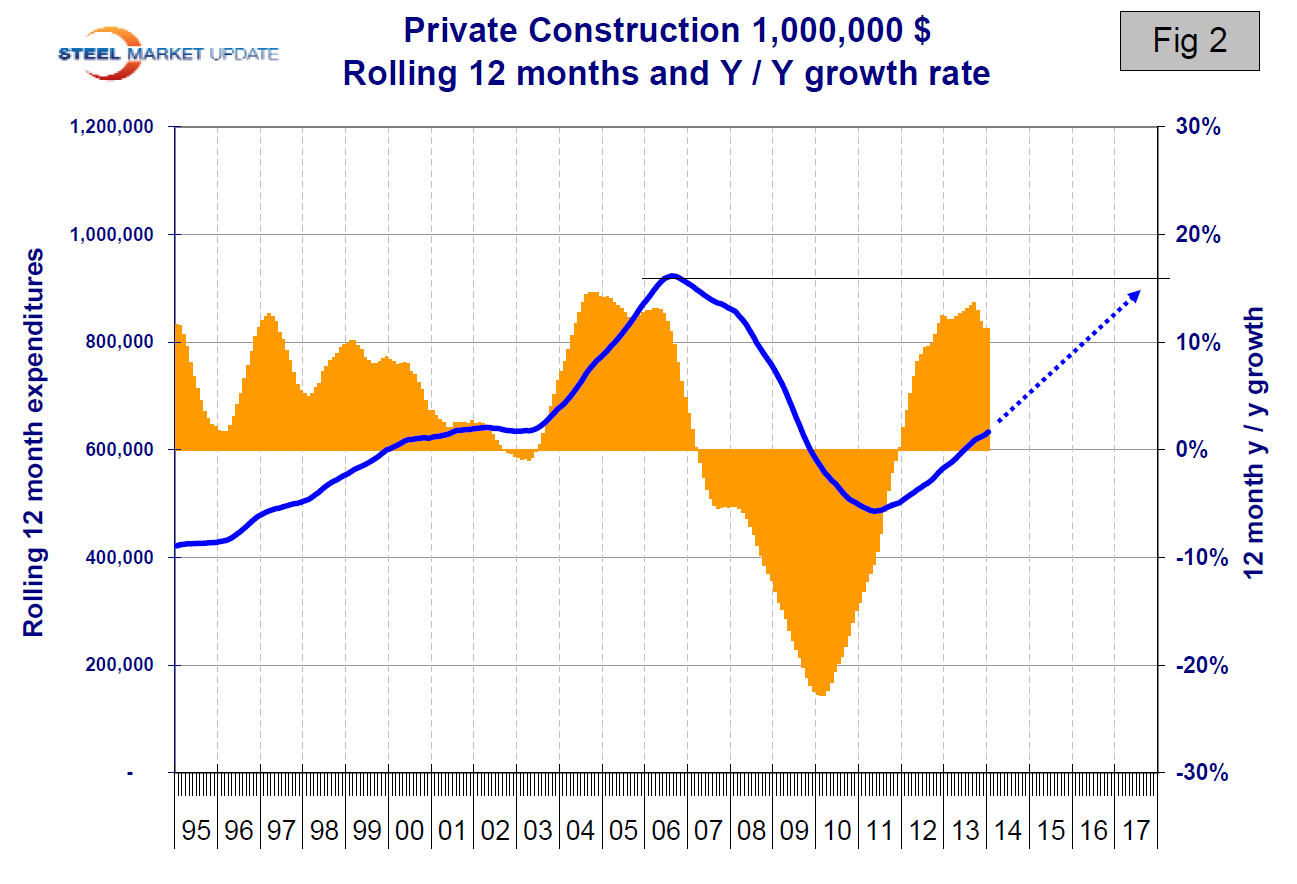 Private Construction: Private work slowed from an 11.2 percent growth rate in 12 months y/y to an 8.2 percent rate in 3 months y/y (Table 2). However January 2014 exceeded January 2013 by 12.9 percent in spite of the inclement weather so this is an encouraging sign. The growth of private work has exceeded 10 percent for the last 18 months but at the current rate it will be mid 2017 before recovery is complete (Figure 2). Table 2 breaks down the private sector into project types. Residential buildings, both single and multi-family are growing rapidly though slowing. This data coincides well with the housing starts data that SMU reports every month. Private non residential buildings are growing at a 10.9 percent rate and accelerating. Within private non residential, only health care and religious buildings are showing a sustained contraction. On the other hand, hotels / motels are showing surprising strength and accelerating.
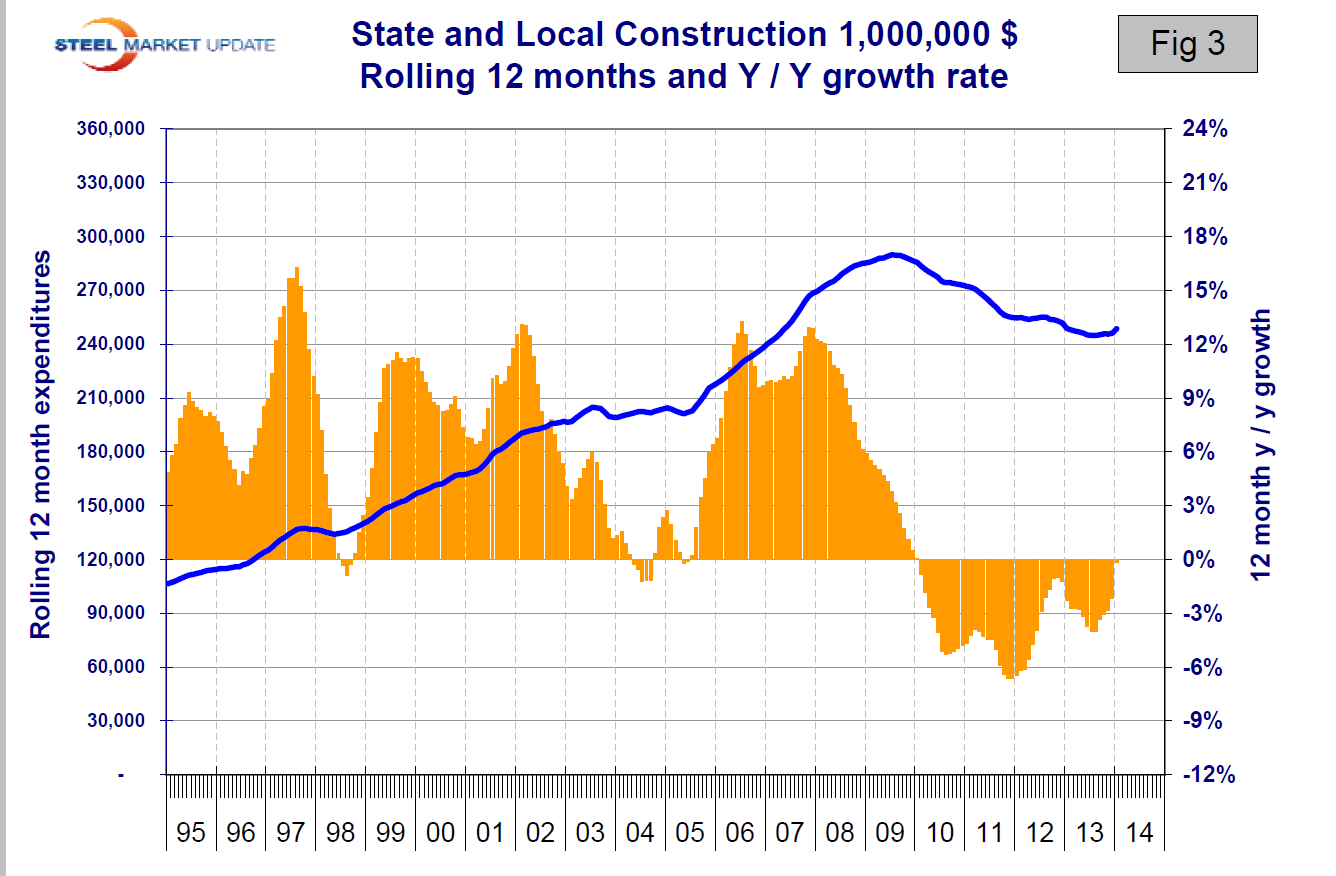 State and Local Construction: S&L work surged from a 12 month y/y rate of negative 0.1 percent to a surprising positive 3 month rate of 5.4 percent (Table 3). In spite of the January surge, there is no recovery in sight for S&L financed work which has been declining for four years (Figure 3). Within this sector; non residential buildings contracted at a 0.9 percent rate. Educational buildings are by far the largest sub sector of S&L non residential at $6 billion in the last 12 months but contraction continues with little improvement in the last few months. Transportation terminals are doing extremely well with a 3 month growth rate of 8.8 percent and a very strong January. The slight uptick in the total S&L expenditures line in Figure 3 is encouraging but the odds are that this sector will not show significant growth any time soon. Moody’s Economy.com summed this up very well, “Government spending on construction should be doing better than it is, given that income and sales tax revenues are well on the way to recovery and that property values are now on the increase. Nevertheless, many state and local governments are far from healthy, as increased revenues have been more than offset by increased future obligations, including the need to replenish reserve and rainy-day funds and to service defined benefit liabilities, pensions foremost. Therefore, there is little room for increased public spending on all but the most essential categories; spending on street and highway construction has shown promising growth, but a decline in construction spending for public schools, sewage systems and power grids is cause for concern. Given the financial weakness of many sub-national governments, it may be some time before public construction catches up to pre-recession totals.”
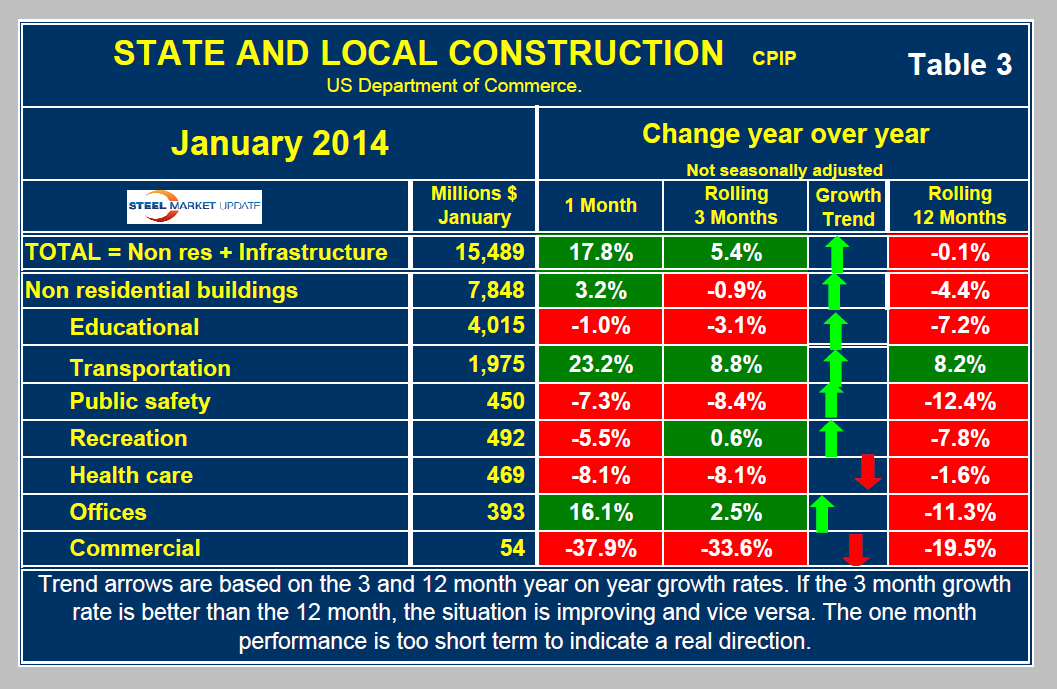
Drilling down into the private and S&L sectors as presented in Tables 2 and 3 shows which project types should be targeted for steel sales and which should be avoided. There are some project types within S&L that are doing quite well.
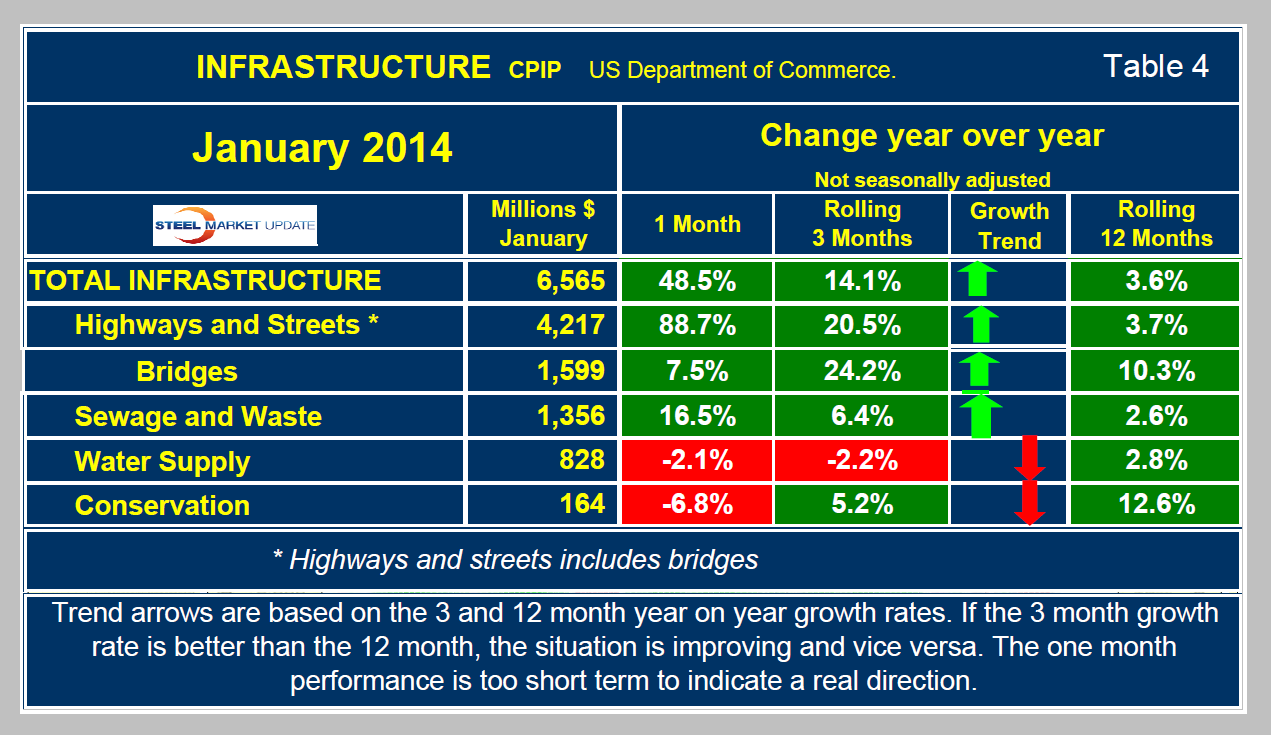
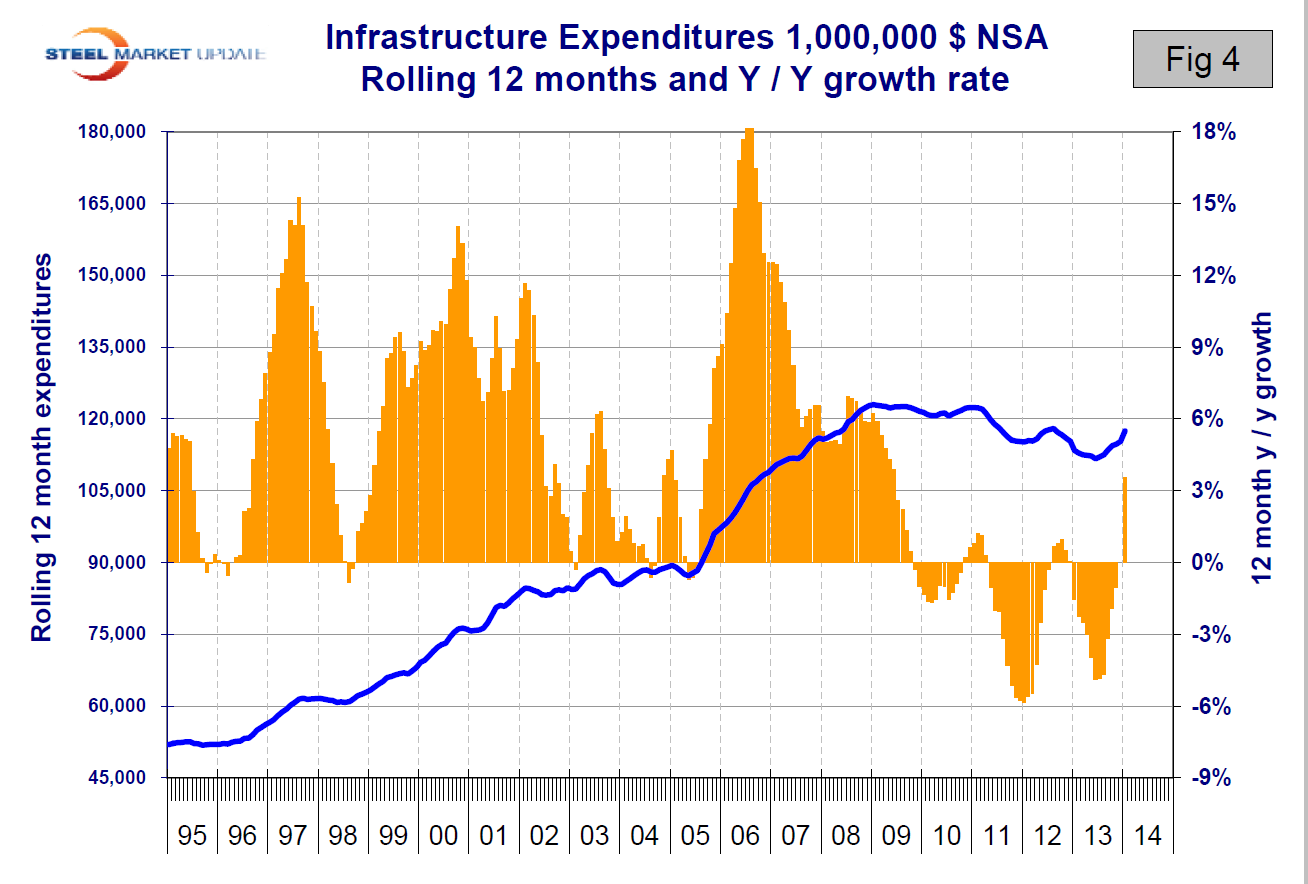 Infrastructure: Highway and streets construction which includes bridges grew at a surprisingly strong rate in the three months through January. Total infrastructure expenditures accelerated from a 3.6 percent growth rate in 12 months through January to 14.1 percent in 3 three months through January (Table 4). The only sectors that slowed in three months through January were water supply and conservation. The Association of General Contractors of America commented on March 3rd: “Highway and street construction is an example of a category that may have data revision in coming months. The preliminary January data show spending soared 3.7 percent in January and 15 percent year-over-year. But they cautioned that federal highway funding could decline abruptly as early as this summer if the federal highway trust fund runs out of money as predicted. They urged Congress and the president to work together to pass new transportation funding measures as quickly as possible.” Based on the Commerce Department CPIP reports, the state of infrastructure expenditures is not as bad as the press would have us believe. At the present rate of growth, infrastructure expenditures will reach the pre-recessionary level before the end of 2014 (Figure 4). This is far from the case with residential and non residential construction. New transportation proposals are alive in Congress which, if successful, will maintain and then accelerate the increase in infrastructure construction.
From ‘The Hill Transportation and Infrastructure Blog’ on February 27th: Transportation advocates are saying that they are “encouraged” by a pair of proposals released by President Obama and House Republican budget writers to boost infrastructure spending. Obama unveiled a proposal for a four-year, $302 billion transportation bill that he said could be paid for with $150 billion in savings from closing corporate tax loopholes, in addition to revenue collected by the federal gas tax. Meanwhile, House Ways and Means Committee Chairman Dave Camp (R-Mich.) released a proposed tax reform bill that included provisions redirecting $126.5 billion to transportation projects. American Society of Civil Engineers (ASCE) President Randy Over said both proposals were steps in the right direction. “President Obama’s proposed $302 billion transportation plan is an encouraging step forward in addressing the impending cliff our nation faces this year with the Highway Trust Fund,” Over said in a statement. “When the Highway Trust Fund becomes insolvent later this year, road and bridge projects will cease, payments will stop, and the shock waves throughout our economy will be significant. As if the president’s proposal weren’t momentum enough, we were also happy to see a transportation proposal from House Ways and Means Chairman Dave Camp,” Over continued. “Both the President’s proposal and Chairman Camp’s proposal offer a much-needed fix for the Highway Trust Fund. “Ultimately, America’s transportation system needs long-term, sustainable revenue sources,” he continued, “but we are encouraged by this bi-partisan effort to identify funding before it is too late. For state DOTs, local governments, and transit agencies across the country, it’s difficult to plan a large-scale project if you don’t know how much funding there will be or if the project can even be completed.” Both Obama and Camp’s proposals would deliver a badly needed infusion of cash to the Highway Trust Fund, which is currently being projected to go bankrupt as early as August. The trust fund has traditionally been filled by the 18.4 cents per gallon federal gas tax, but collections have dwindled as cars have become more fuel efficient and Americans drove less frequently during the most recent economic downtown. The gas tax brings in about $34 billion per year to the federal government’s coffers. However the current transportation bill that is scheduled to expire in September includes more than $50 billion worth of spending on road and transit projects. Many transportation advocates have pushed Congress to increase the gas tax or replace it with a more viable funding source to avoid a repeat of the current shortfall.
American Association of State Highway and Transportation Officials Executive Director Bud Wright said either of the competing proposals to provide a one-time infusion of cash would be better than doing nothing to restore the viability of federal transportation funding. “The crisis facing the Highway Trust Fund and our national transportation infrastructure is very real,” Wright said in a statement. “It is good news that the administration and Congressional leadership in both houses are looking seriously at strategies to invest in transportation and maintain the solvency of the Highway Trust Fund and the programs it supports.”
SMU Comment: we are encouraged by the January CPIP report from the Commerce Department which if trends continue into the summer will begin to close the gap between where steel demand currently is and where it should be at this stage of recovery from a recession.