

Analysis

February 19, 2014
January Housing Starts and Permits
Written by Peter Wright
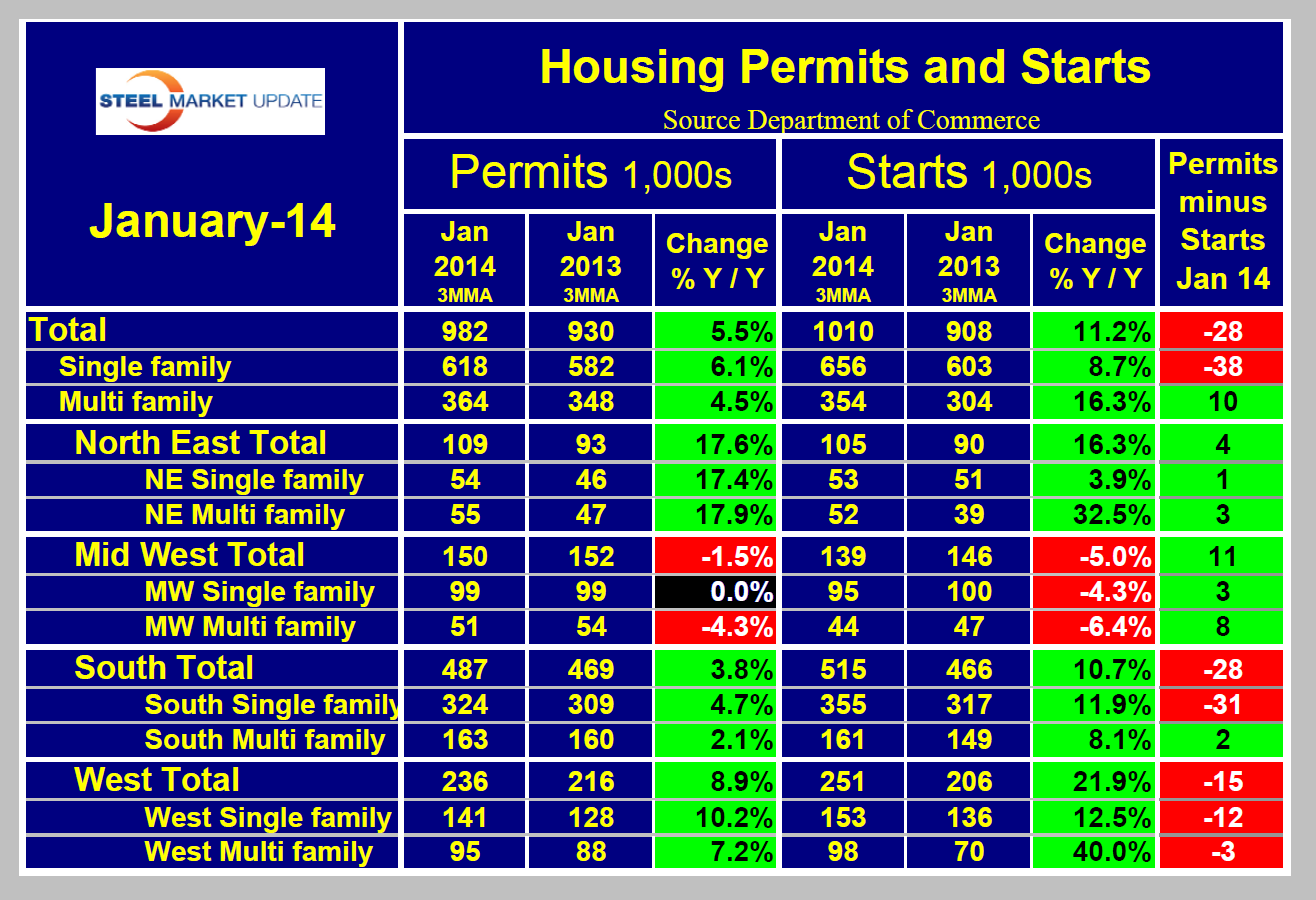
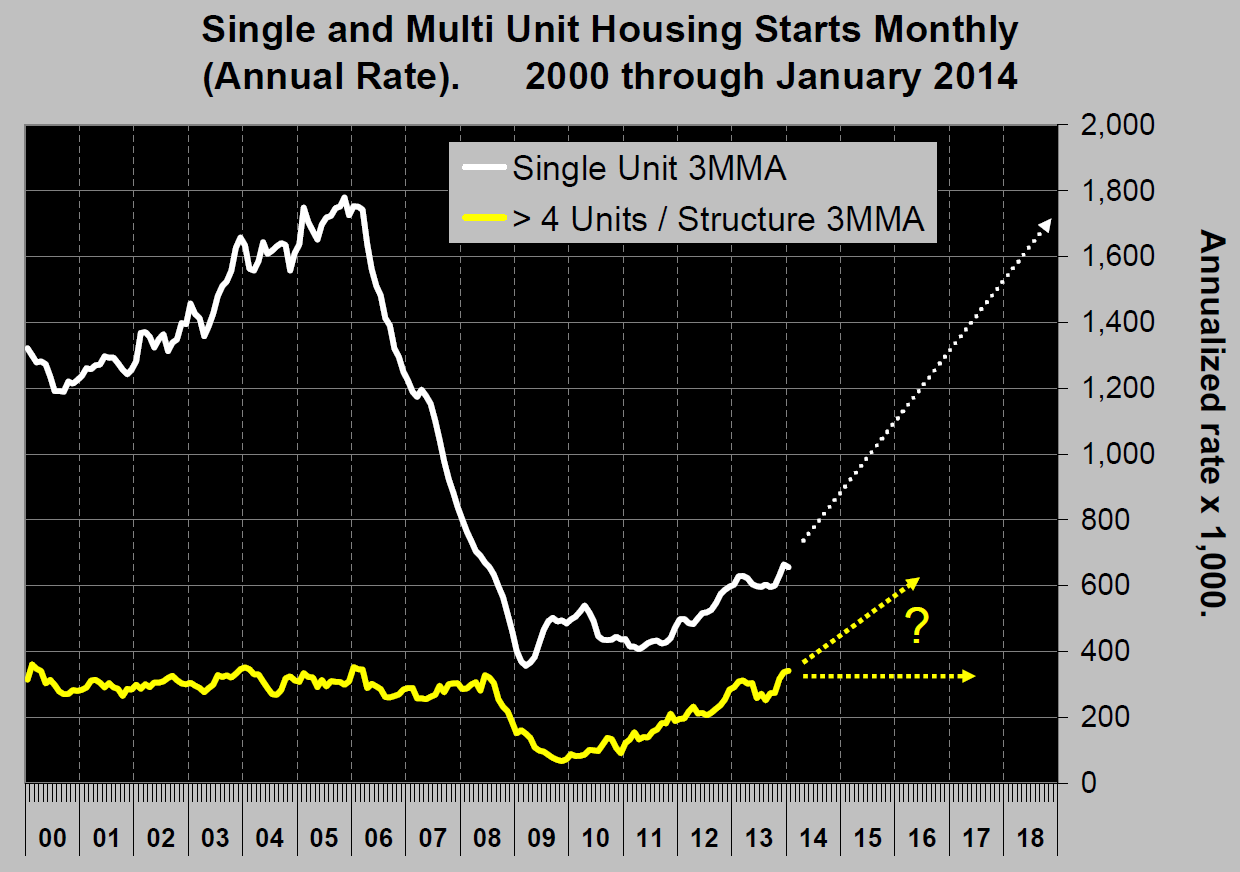
Total housing starts in January were down 16 percent from December and 20.1 percent from November with very little difference between single and multi-family construction. That is the news headline but on a closer analysis the situation is not so dire. On a three month moving average basis the recent results form only a slight blip on the long term growth curve (Figure 1).
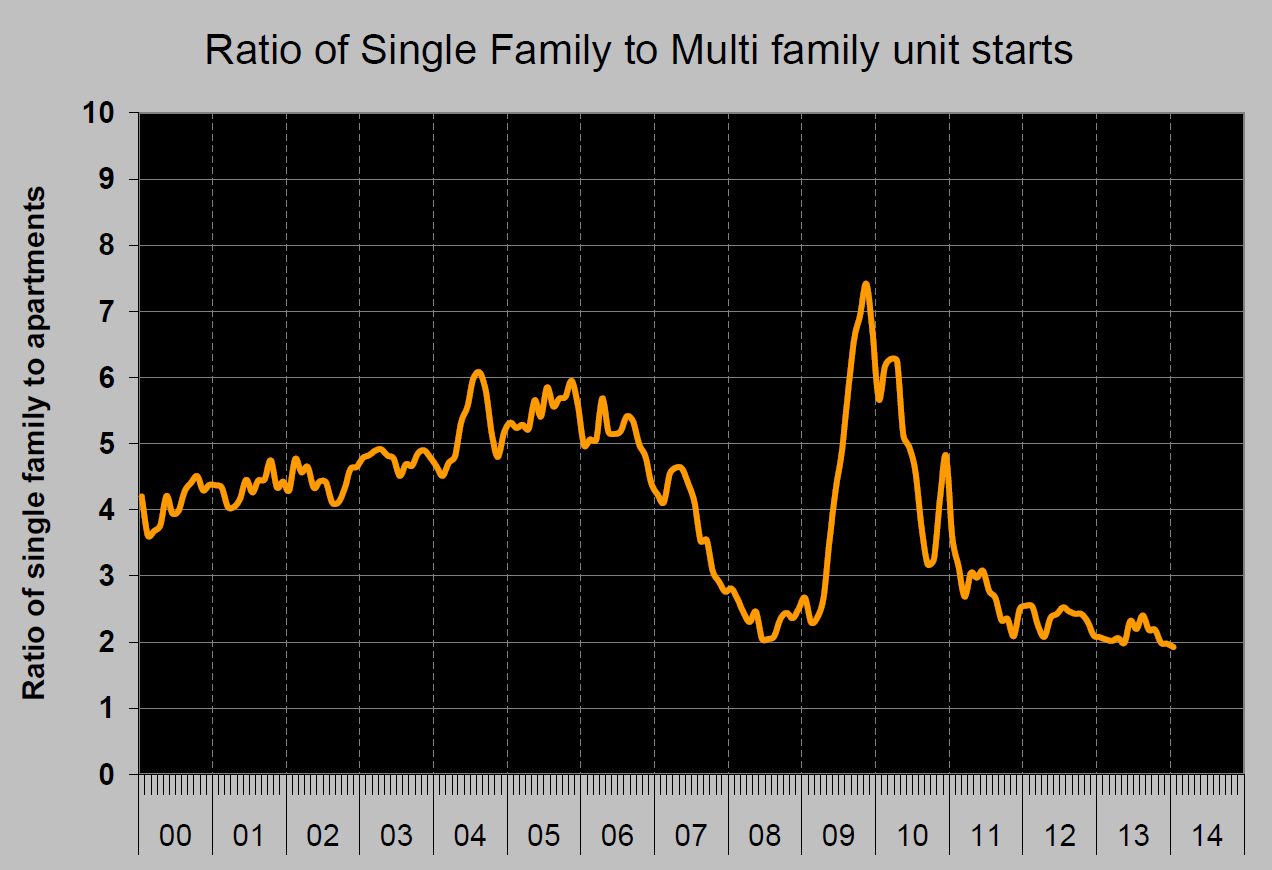
The great unknown at this time is, “Where is multi-family headed?” The growth trajectory of single family units is well established and, barring unforeseen economic changes, full recovery will occur sometime around 2018. The prognosis for multi-family is much less clear because that sector has already fully recovered. Future growth of multifamily will be driven by the consumer’s attitude to the desirability of home ownership. Clearly the housing bubble and bust has changed those attitudes possibly on a generational basis. Apartment rental now seems preferable to home ownership in the minds of a significant proportion of the public. This is continuing to drive down the ratio of single to multi-family units which now stands at the lowest level in 30 years (Figure 2). The small down tick in Figure 1 was caused entirely by a decline in starts in the Mid West. The South and West are growing strongly while the North East is trending flat.
In November and December total starts were well above the long term trend line which was the main reason that January’s result appeared depressed. Comparing starts to permits illustrates this point. Starts exceeded permits in both November and December. These were the only months since March when this was the case. In January on a 3MMA basis, total residential starts exceeded permits by 28,000. This was driven by single family; the reverse was the case for multi family. Starts exceeding permits could be a harbinger of a future slowdown but it will be necessary to see data from the spring months after the weather has improved to determine if this is a trend. On a 3MMA basis, the South and the West did the worst in January and the Mid West and North East did best (Table 1). This is the reverse of the starts growth trend described at the end of the last paragraph of this analysis so maybe a regional leveling is underway.
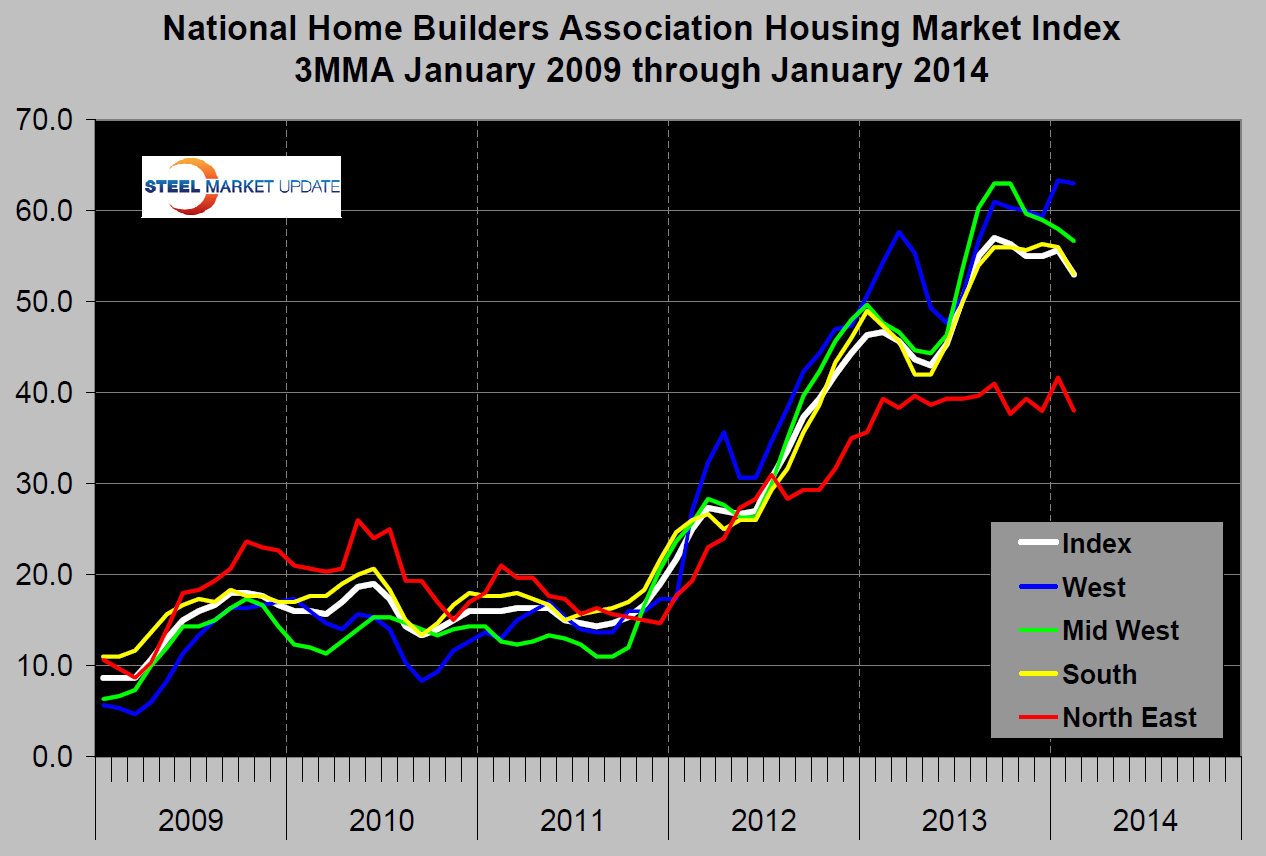
The National Association of Home Builders sentiment index was released this week for January and was seen to have taken the largest hit since the data was first released in 1985. This was blamed on the weather in the NAHB commentary with expectations of an improvement in the spring. On a 3MMA basis home builders confidence is still above the positive/negative threshold of 50 (Figure 3). Only in the North East is confidence below the threshold.
Realty Trac released their Year-End 2013 U.S. Foreclosure Market Report on January 16th showing foreclosure filings — default notices, scheduled auctions and bank repossessions. The 1.4 million total properties with foreclosure filings in 2013 was the lowest annual total since 2007, when there were 1.3 million properties with foreclosure filings. The report also shows that 1.04 percent of U.S. housing units (one in every 96) had at least one foreclosure filing during the year, down from 1.39 percent of housing units in 2012 and down from a peak of 2.23 percent of housing units in 2010. Including the 2013 numbers, over the past eight years 10.9 million U.S. properties have started the foreclosure process of which 5.6 million have been repossessed by lenders.
SMU Comment: We believe that housings relationship to steel consumption goes far beyond the level of actual steel use in residential construction for two reasons. First housing is an indicator of both non residential and infrastructure construction. Secondly the level of housing demand is a measure of the consumer’s mental recovery from the recession which in turn will drive GDP growth and demand for all steel products.


