Market Data

January 29, 2014
Durable Goods Report for December
Written by Peter Wright
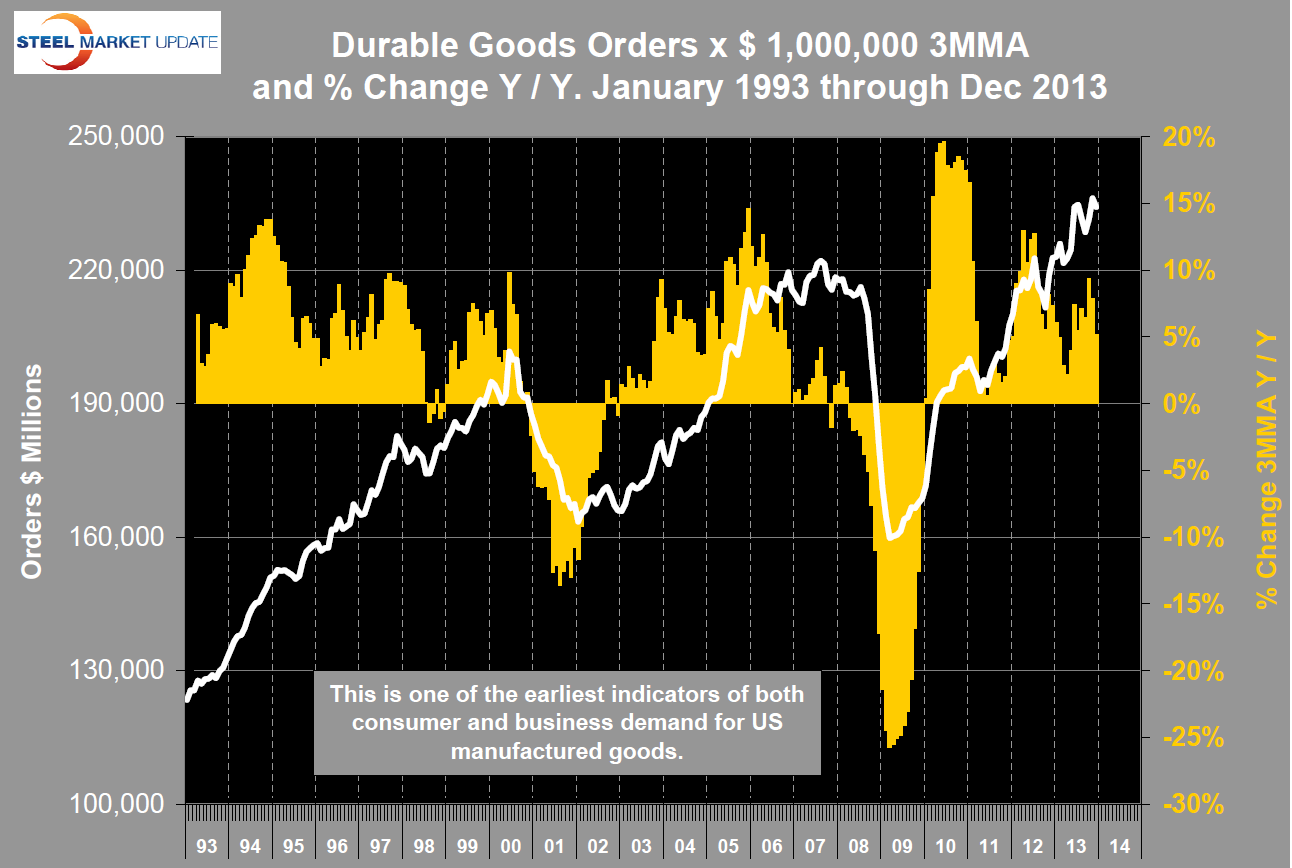
Durable goods orders declined in December as did the three month moving average. Not a cause for concern at this point because even the 3MA of this indicator tends to be quite erratic (Figure 1). The year over year growth rate of the 3MMA declined from 7.9 percent in November to 5.1 percent in December. Of the B$10.3 decline in December, B$3.8 was in civil aircraft and parts which are a highly volatile component. Shipments were also down in December but unfilled orders and inventories both increased to the highest levels since 1992 when this series was first published.
 The Census Bureau press release issued today read as follows:
New orders for manufactured durable goods in December decreased $10.3 billion or 4.3 percent to $229.3 billion, the U.S. Census Bureau announced today. This decrease, down two of the last three months, followed a 2.6 percent November increase. Excluding transportation, new orders decreased 1.6 percent. Excluding defense, new orders decreased 3.7 percent. Transportation equipment, also down two of the last three months, led the decrease, $7.7 billion or 9.5 percent to $73.1 billion. This was led by nondefense aircraft and parts, which decreased $3.8 billion.
Shipments of manufactured durable goods in December, down following four consecutive monthly increases, decreased $4.5 billion or 1.9 percent to $232.8 billion. This followed a 1.3 percent November increase. Transportation equipment, also down following four consecutive monthly increases, led the decrease, $4.1 billion or 5.7 percent to $68.3 billion.
Unfilled orders for manufactured durable goods in December, up ten of the last eleven months, increased $3.9 billion or 0.4 percent to $1,061.5 billion. This was at the highest level since the series was first published on a NAICS basis in 1992, and followed a 0.9 percent November increase. Transportation equipment, up four consecutive months, drove the increase, $4.8 billion or 0.7 percent to $659.1 billion.
Inventories of manufactured durable goods in December, up eight of the last nine months, increased $3.0 billion or 0.8 percent to $387.8 billion. This was at the highest level since the series was first published on a NAICS basis, and followed a 0.3 percent November increase. Transportation equipment, up nineteen of the last twenty months, led the increase, $1.3 billion or 1.1 percent to $122.1 billion.
Non-defense new orders for capital goods in December decreased $4.3 billion or 5.0 percent to $82.5 billion. Shipments increased $0.6 billion or 0.8 percent to $75.4 billion. Unfilled orders increased $7.1 billion or 1.1 percent to $642.7 billion. Inventories increased $1.2 billion or 0.7 percent to $176.7 billion. Defense new orders for capital goods in December decreased $1.9 billion or 21.5 percent to $6.8 billion. Shipments decreased $1.3 billion or 11.5 percent to $9.6 billion. Unfilled orders decreased $2.8 billion or 1.7 percent to $161.9 billion. Inventories increased $0.5 billion or 2.1 percent to $22.9 billion.
SMU comment; Durable goods orders are one of the earliest indicators of both consumer and business demand for US manufactured goods. The trend line is still on track to reach B$250 / month by the end of this year. The positive trajectory of Durable Goods orders confirms other manufacturing trends that we track, its erratic nature is driven in large part by the fluctuation in orders for civil aircraft.


