

Market Data

December 17, 2013
SMU Service Center Apparent Deficit Drops to -58,000 Tons
Written by John Packard
Steel Market Update continues to enhance our proprietary service center inventory model which we call SMU Apparent Excess/Deficit. We are now forecasting service center inventories using our model and, for that reason, in the future we will move this data into the Premium Level within our website.
Using our model shipments, shipments were up year-over-year while inventories were down year-over-year. Our SMU Apparent Deficit model dropped to -58,000 tons vs. -361,000 last month.
Our forecast for November (which we recently shared during our talk at HARDI) was for service center inventories to drop from -361,000 tons to an Apparent Excess of +64,000. We did accurately forecast a dramatic drop in the Deficit but missed on the ending inventory point.
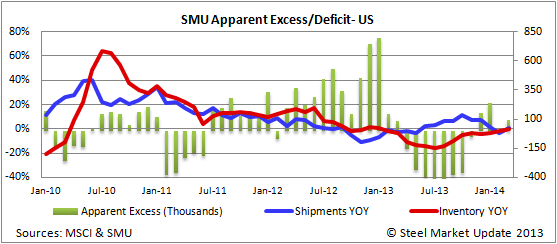
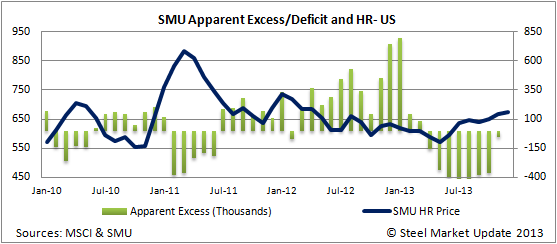
As you can see by the graph below benchmark hot rolled prices continue to rise. With the reduction in Apparent Inventory Deficit, the question is will prices flatten out from here or make a move higher or lower and to what degree. We are forecasting an Apparent Excess in inventories at the end of December (see tables below).
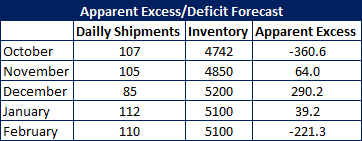
Below are our forecast prior to the most recently announced MSCI data. You can see what our forecast is based on (shipments and inventory projections by month).
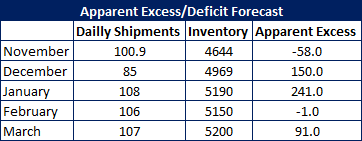
This next table is our new forecast for the months of December 2013 through March 2014. You can compare the two tables to get a sense of what changes the November data made to our calculations.
As we mentioned above, going forward this data will be readily available to our Premium Level members.


