Analysis
January 2, 2014
Construction Value Put in Place (CPIP) through November
Written by Peter Wright
The Commerce Department compiles their information based on the source of financing. These categories are, private, state + local and federal. There are a huge number of sub categories in the private and state + local construction expenditure categories, not so many in federal where expenditures are minimal. At Steel Market Update we combine these sub categories in-order to produce a comprehensive report each month.
In November, total construction expenditures were $77,966 billion down by 8 percent from October but this was purely a seasonal effect. There is no point comparing construction statistics one month or one quarter after another as the results are so seasonal that such a comparison is meaningless. By financing in November, 70.6 percent was privately funded, 27.0 percent was state and local and 2.4 percent was federally financed. Of the total expenditures, 83.6 percent falls into three major categories. Non-residential buildings accounted for $37.646 billion, down 5.5 percent from November 2012, single family residential was $15.171 billion, up 18.1 percent year over year and infrastructure was $12.368 billion up 2.6 percent year over year. Table 1 shows expenditures for November with year-over-year comparisons monthly and on 3 and 12 month rolling averages (3MMA and 12MMA). Total construction in November on a 3MMA basis was up by 5.8 percent year-over-year and up by 6.8 percent on a 12MMA basis. The three month growth rate was less than the 12 month growth rate meaning that momentum was negative and growth slowed slightly in the last three months.
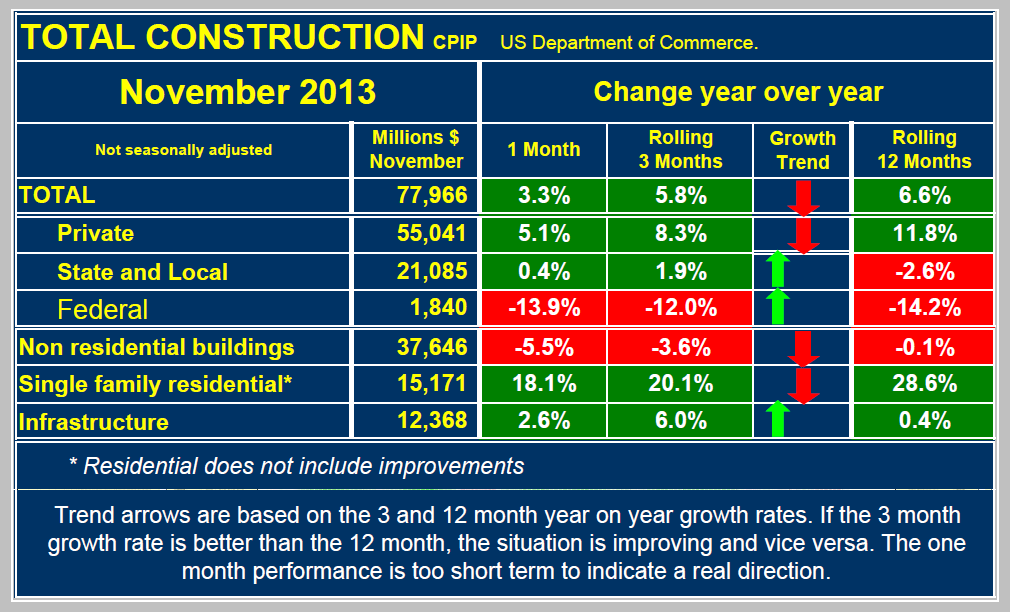
In November, on a 3MMA basis year-over-year private construction grew by 8.3 percent and has been steady since July 2011. State and locally financed construction grew by 1.9 percent and has been in positive territory for three months following 12 straight months of decline. Federally funded work declined by 12 percent continuing 12 straight months of double digit contraction. In the private sector, single family residential grew by 20.1 percent, multi-family residential by 39.1 percent and non-residential contracted by 4.3 percent. This was the second contraction in non-residential after 26 straight months of growth. On a rolling 12 months basis, total private construction has been expanding since November 2011 and in the latest 12 month period grew by 11.8 percent. A double digit growth rate has been sustained for 14 straight months, but even so at the present rate it will be early 2018 before recovery to the previous peak occurs.
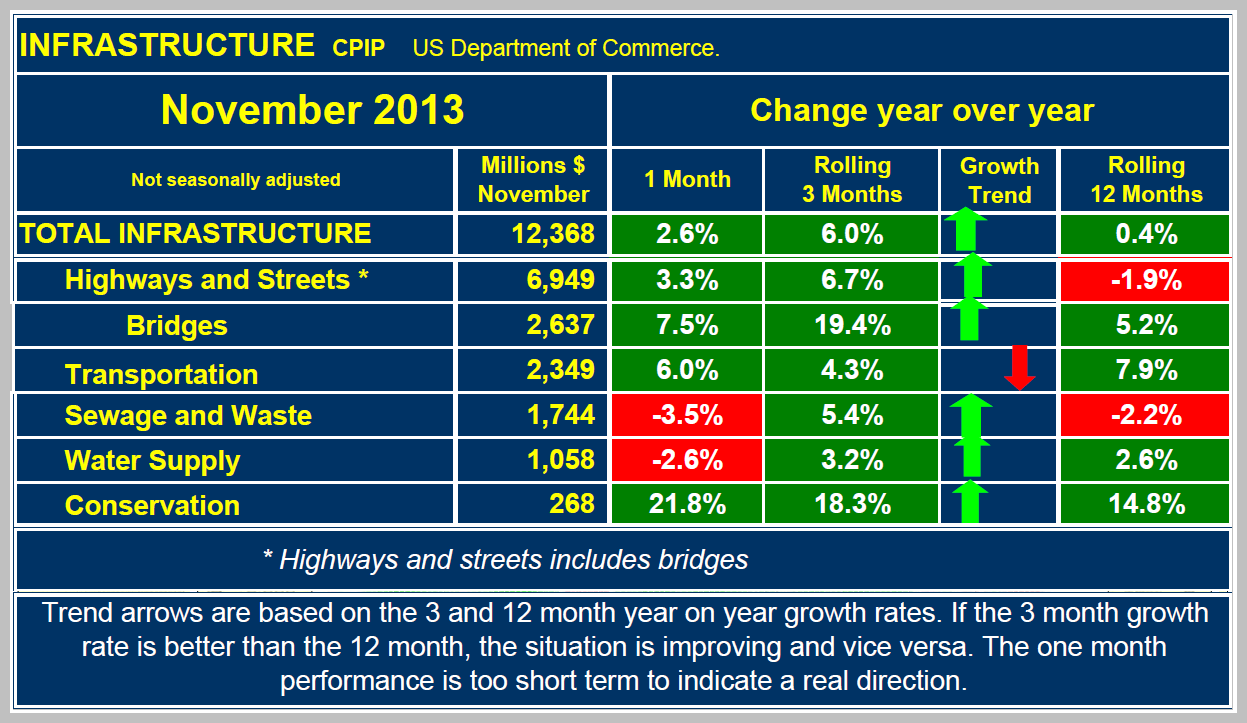
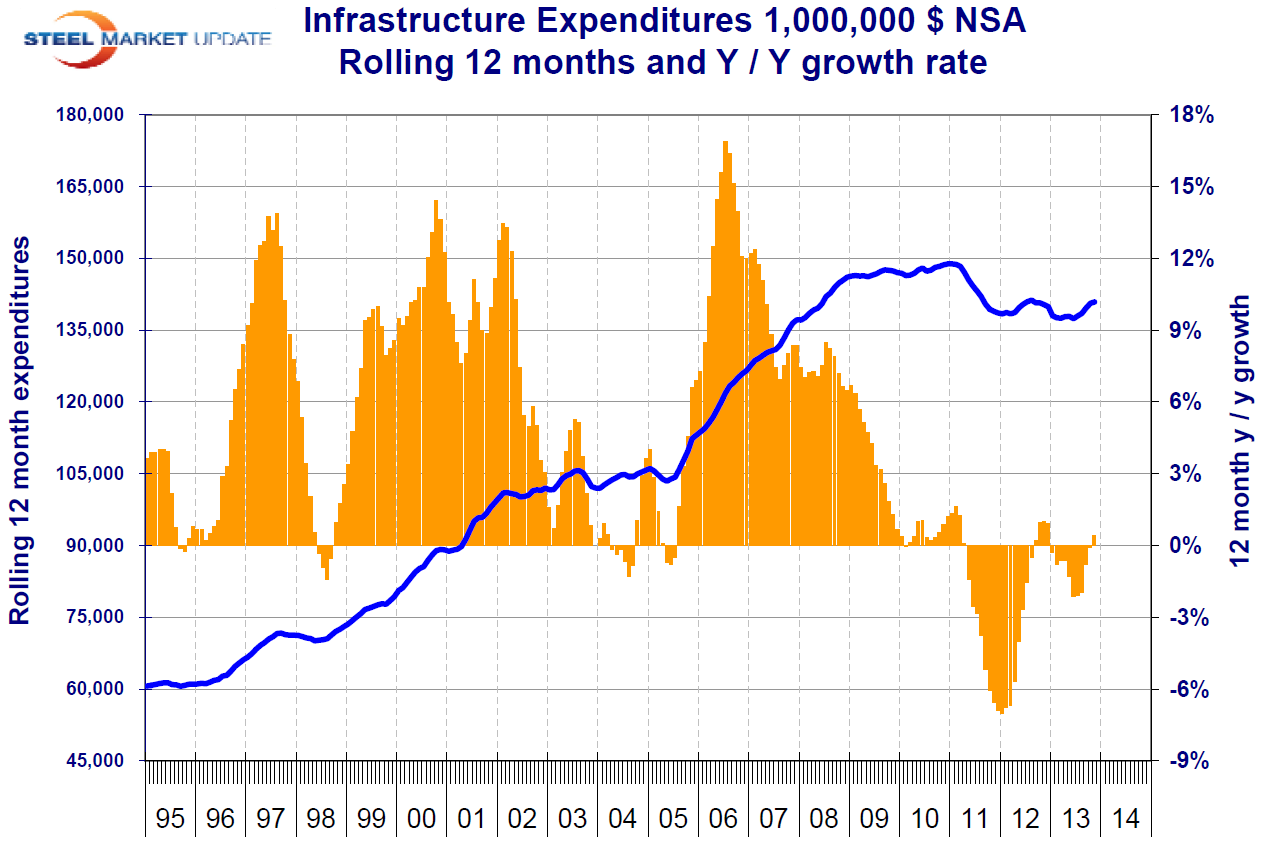 Infrastructure construction grew by 6.0 percent 3MMA year over year and by 0.4 percent 12MMA year-over-year (Table 2). Since the short term growth rate is greater than the long term, momentum is positive; growth has been accelerating for five months. Bridges and conservation have been particularly strong recently. At SMU we believe that the best picture of what is really going on in construction is provided by an examination of the long term rolling 12 month average. Applying this concept to infrastructure yields the picture shown in Figure 1. Infrastructure did not decline anywhere near as much as the construction of buildings, both residential and non-residential, and is still not showing the same sustained recovery as buildings are experiencing. The recessionary decline of infrastructure didn’t even begin until late in Q1 2011 since most projects are very long term. The bottom came in late 2011 and expenditures have been rocking along ever since. Given the financial constraints at all levels of government, we have no idea when infrastructures will return to the level of early 2011 but we don’t expect that to occur before 2017.