Market Data

December 23, 2013
SMU Mid-December Survey Results
Written by John Packard
On Monday, December 16th we began collecting data for our last Steel Market Update flat rolled steel market analysis. The way the system works is over the years Steel Market Update (SMU) has vetted a number of companies (many of whom John Packard did business with in the past). Our current list has approximately 600 companies who are then invited to take our survey twice per month (beginning and middle of each month).
The survey itself contains a number of sections. All of the respondents enter the questionnaire and respond to a short list of questions where we want to produce a collective opinion. This includes questions which determine our SMU Steel Buyers Sentiment Index.
At the end of that section the respondents are asked to identify the kind of company for which they work. The options are: Manufacturer, Service Center, Steel Mill, Trading Company, Toll Processor and Supplier to the Industry. The vast majority of our respondents are either manufacturing companies (latest survey 49% were in this group) or service centers (39% were in this group).
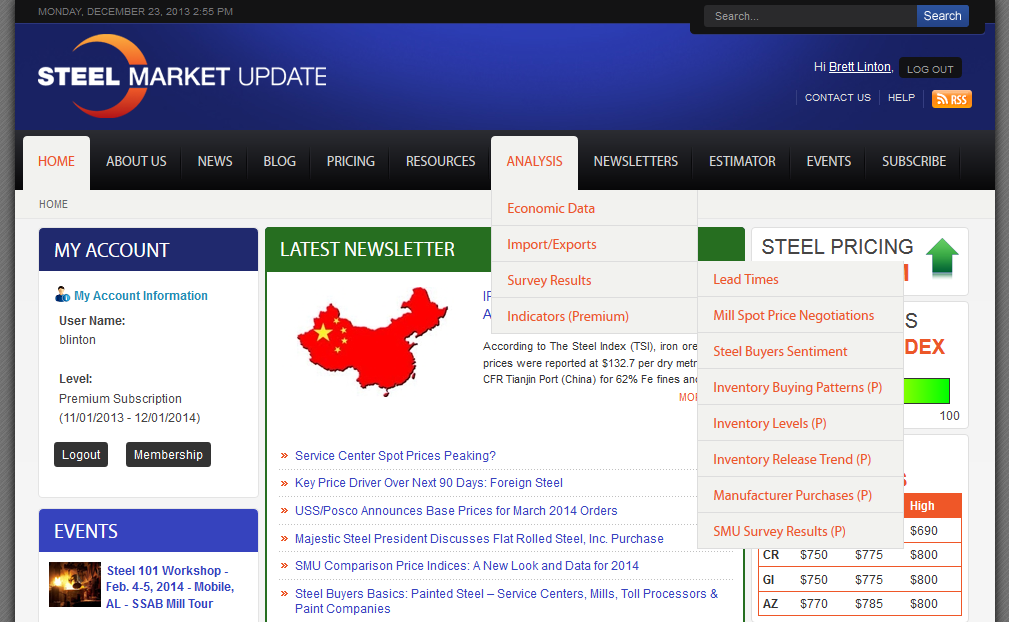
We have placed a Power Point presentation of the survey results on our website under the Analysis Tab you then go to the Survey Results tab in the drop down menu and then a side menu will have SMU Survey Results tab which can only be seen by Premium Level Members.

On the weeks when we host a survey we expect to post the survey at the end of the week – usually on Friday. We are finding the best browser to use when trying to download the survey is Internet Explorer (IE). If you are unable to download the survey please contact us at info@SteelMarketUpdate.com and we will send you a PDF.
This past week the results showed the following:
1) SMU Steel Buyers Sentiment Index was +37 down from a +39 two weeks prior but well above the +28 recorded at the same time last year. The high for the year 2013 was +42 during the middle of August and the low for the year was a +15 recorded at the beginning of March.
2) SMU Future Buyers Sentiment Index was +53 – down 4 points from the +57 recorded at the beginning of December which was the high for the year. The low for the year was a +30 measured on May 1, 2013.
3) Our survey is showing mild improvement in demand as 29% of the total respondents reported demand as improving. This is up from 27% at the beginning of the month and 21% from the beginning of November.
4) Our respondents are mixed as to where prices will head from here – actually they are semi-mixed as only 12% believe prices will fall while 43% are of the opinion prices will rise and 45% believe prices will move sideways over the next 30 to 60 day time period.
5) We reported in last evenings edition of SMU that the main price driver for steel will be an influx of cheap foreign steel with 29% of the total response base.
6) 62% of the manufacturing companies and 46% of the service centers reported having placed all of their first quarter 2014 contract steel needs.
7) 15% of manufacturing companies and 30% of service centers believe they will need to place more spot tons than normal during the 1st Quarter.
8) We are seeing more manufacturing companies reporting that their company is buying more steel now than they were during the same time period one year ago (31% more, 16% less).
9) Service centers have not seen much change in the releases from their customers compared to one year ago (29% more steel, 25% less steel).
10) We are seeing signs of manufacturing demand growing as those reporting demand as increasing substantially or increasing marginally went from 30% in early November to 42% now.
11) Inventory buying patterns are showing both manufacturers and distributors as fairly well balanced with 67% of manufacturers and 70% of distributors are maintaining inventory levels (as opposed to building or reducing inventories).
12) Service center inventories were measured at 2.16 months down slightly from the 2.3 months reported two weeks ago.
13) We reported on both the manufacturers view and distributors view regarding spot price movement in last night’s SMU newsletter.
14) Service centers reported manufacturing customer orders as being stable (78% of their manufacturing customers are maintaining their orders).
15) Mill lead times were reported as normal by 70% of the manufacturers while 49% of the service centers felt the same way. 38% of the service centers said lead times were slightly longer than normal (26% of manufacturing companies).
16) Mill negotiations were reported last week with galvanized being the most aggressively negotiated item at 56% and cold rolled the least at 30%.
17) Lead times based on an average of our responses has hot rolled at 4.23 weeks, cold rolled at 6.04 weeks, galvanized at 6.51 weeks and Galvalume at 6.83 weeks.
18) The spread between foreign and domestic prices was deemed attractive by 79% of manufacturing companies and 72% of service centers.
19) Only 36% of manufacturing companies and 41% distributors reported that their company was placing new foreign orders at this time. This is at the high end of the historical range for both industry segments.
Our next market analysis will begin on Monday, January 6, 2014.
Have a Happy New Year!


