

Market Data

November 26, 2013
US Home Price Index up 11.2% Y/Y
Written by Sandy Williams
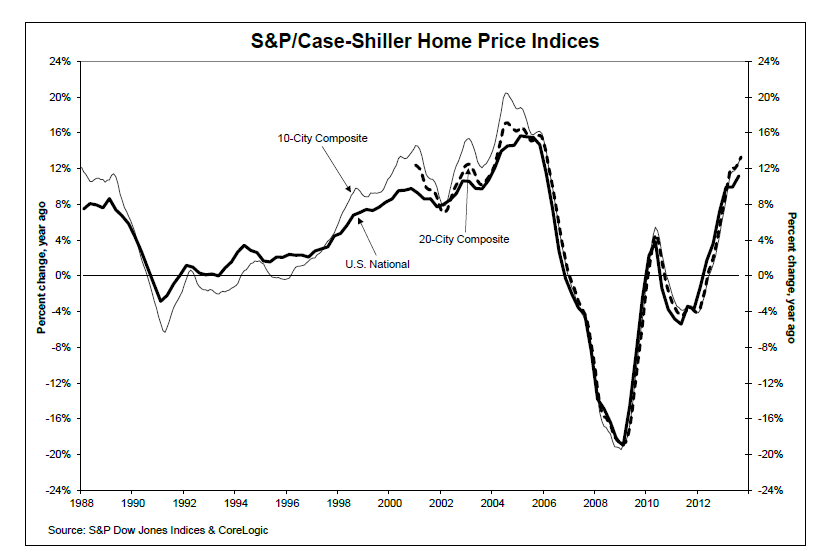
The S&P/Case Shiller U.S. National Home Price Index rose 11.2 percent year-over-year for its highest level since 2006, according to data compiled through September 2013. On a quarter-over-quarter basis, the third quarter index rose 3.2 percent.
The index is based on the annual returns of 10-City and 20-City Composites. Twelve of the 20 cities posted double-digit annual returns in September with home prices increasing the most in Western cities. Momentum may be slowing, however, as 19 cities had lower monthly returns in September than in August.
“The strong price gains in the West are sparking questions and concerns about the possibility of another bubble,” says David M. Blitzer, Chairman of the Index Committee at S&P Dow Jones Indices. “However the talk is focused on fear of a bubble, not a rush to join the party and buy. Moreover, other data suggest a market beginning to shift to slower growth rather than one about to accelerate. Existing home sales weakened in the most recent report, home construction remains far below the boom levels of six or seven years ago and interest rates are expected to be higher a year from now.
“Housing continues to emerge from the financial crisis: the proportion of homes in foreclosure is declining and consumers’ balance sheets are strengthening. The longer run question is whether household formation continues to recover and if home ownership will return to the peak levels seen in 2004.”


