Market Data

November 17, 2013
Industrial Production & Manufacturing Capacity Utilization
Written by Peter Wright
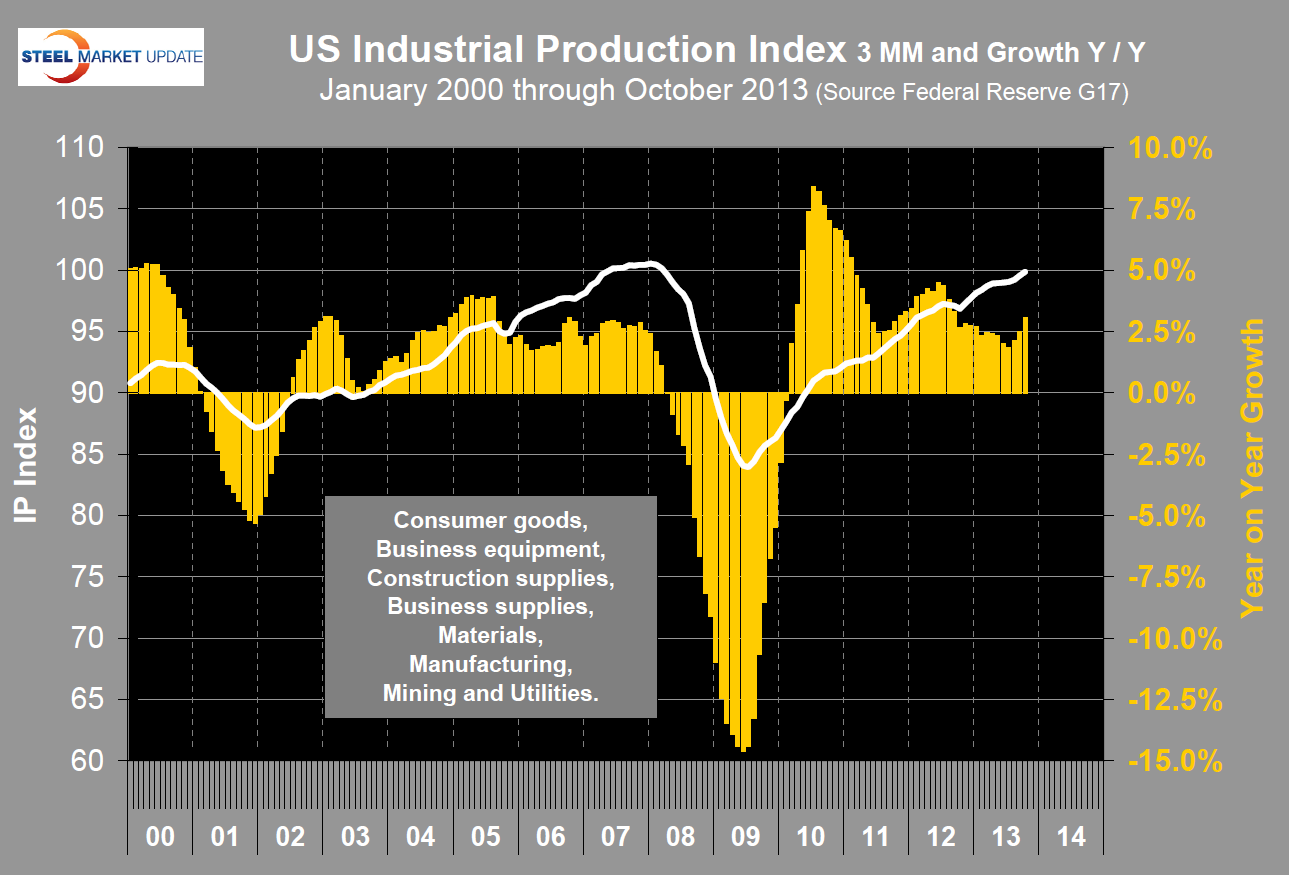
Both industrial production (IP) and manufacturing capacity utilization data points are reported in the Federal Reserve G17 data base. The IP index was reported as 99.98 for October, down by 0.14 from September.
This index is based on the July 2007 level being defined as 100. The three month moving average, (3MMA) accelerated to a growth rate of 3.1 percent year-over-year, the best result since September 2012 and the third month of accelerating growth rate (Figure 1). This is another example of how not to get swayed by a single months result.
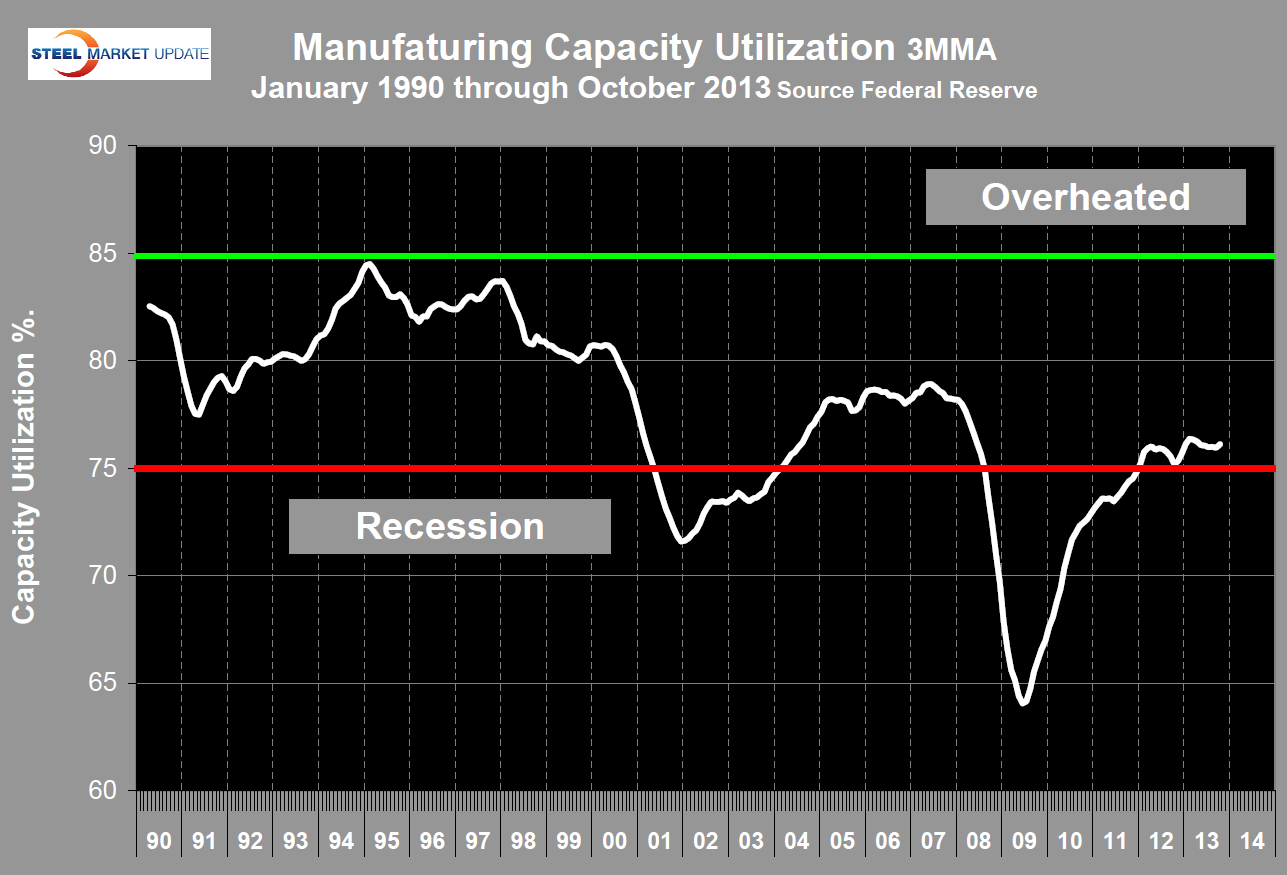
Manufacturing capacity utilization was 76.2 percent in October, up from 76.06 in September. The 3MMA rose by 0.17 percent to 76.12 percent and was up by 0.94 percent year-over-year (Figure 2). There is evidently lots of unused capacity out there which is in line with the lackluster job creation numbers for manufacturing. Manufacturing has had a net loss of 2,000 jobs in eight months through October, year to date has only generated 35,000 jobs. This is partly a result of continuing productivity gains which have helped to make U.S. manufacturing more attractive. Unit labor costs for manufacturers have fallen 5.0 percent since the second quarter of 2009 (the end of the recession), with unit labor costs for durable goods down an even stronger 11.1 percent in that time frame.
Moody’s made the following comments in Economy.com: “Industrial production fell unexpectedly in October, but the miss was due to larger than anticipated declines in utilities and mining production. These categories can be volatile from month to month, and weakness is not expected to persist. Meanwhile, the more important details related to manufacturing were generally in line with expectations, with the trend in production improving noticeably since earlier in the year. The recently released GDP report confirmed that manufacturing has received a boost from an increase in the pace of inventory building. Real non-farm inventories contributed almost 0.75 percentage point to growth during the third quarter, and a big chunk of this contribution came from manufacturing.”
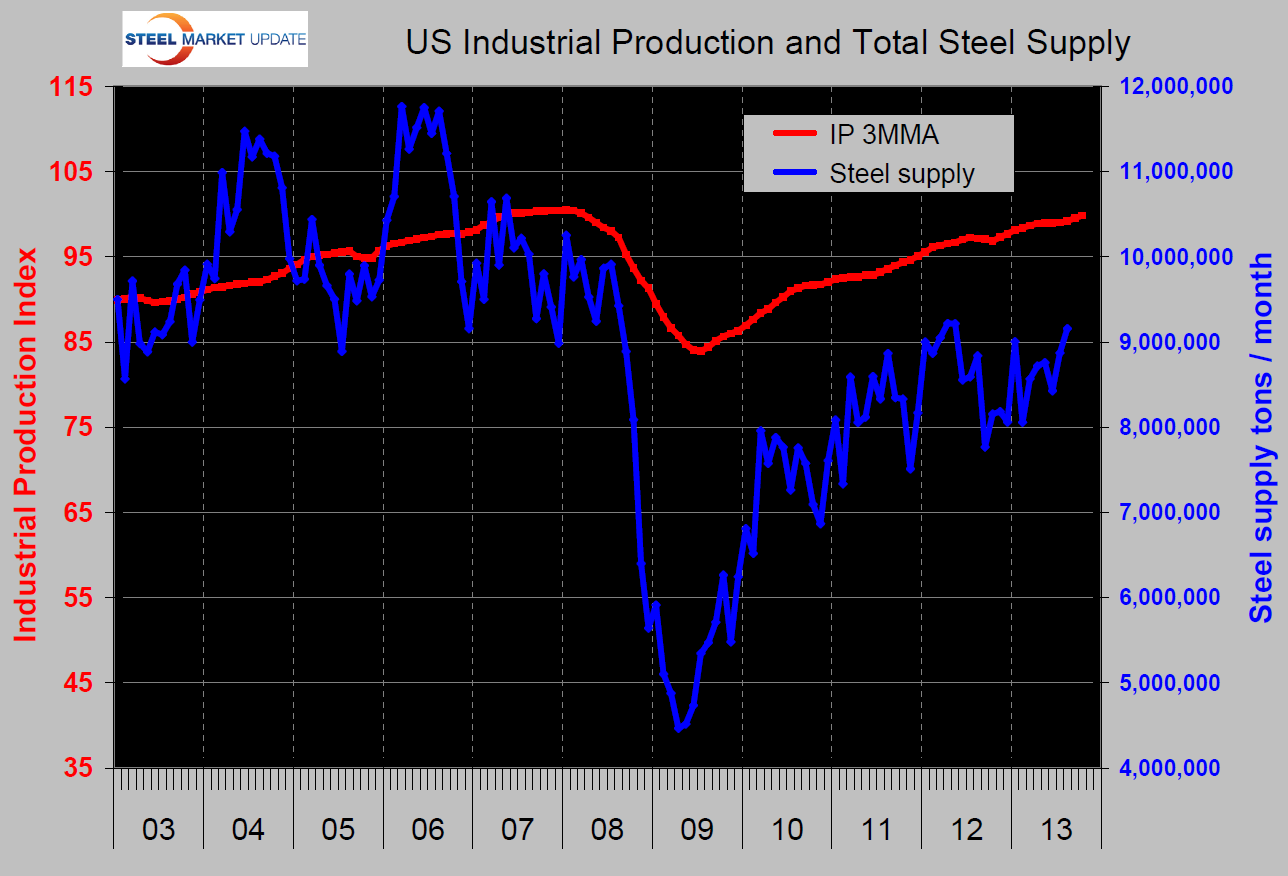
SMU Comment: prior to the recession there was a reasonable correlation between industrial production and steel supply, although steel was very much more volatile in this comparison just as it is against GDP (Figure 3). We have many indicators that suggest that steel supply is much lower than it should be at this stage of a recovery and IP is one of them. We believe the main reason for the discrepancy is the continued low activity by historical standards of the major sectors of construction. This includes, housing, non residential buildings and infrastructure.


