Prices

October 29, 2013
Industrial Production and Manufacturing Capacity Utilization, September 2013
Written by Peter Wright
Both these data points are reported in the Federal Reserve G17 data base. The Industrial Production (IP) index was reported as 100.04 for September, up by 5.7 percent from the 99.47 result in August. This was the first month >100 since February 2008. The three month moving average (3MMA) increased by 2.5 percent year over year (Figure 1). This was the second month of accelerating growth rate. Industrial production is still the least up-beat of the manufacturing indicators so the reversal of it’s growth trend is a welcome sign.
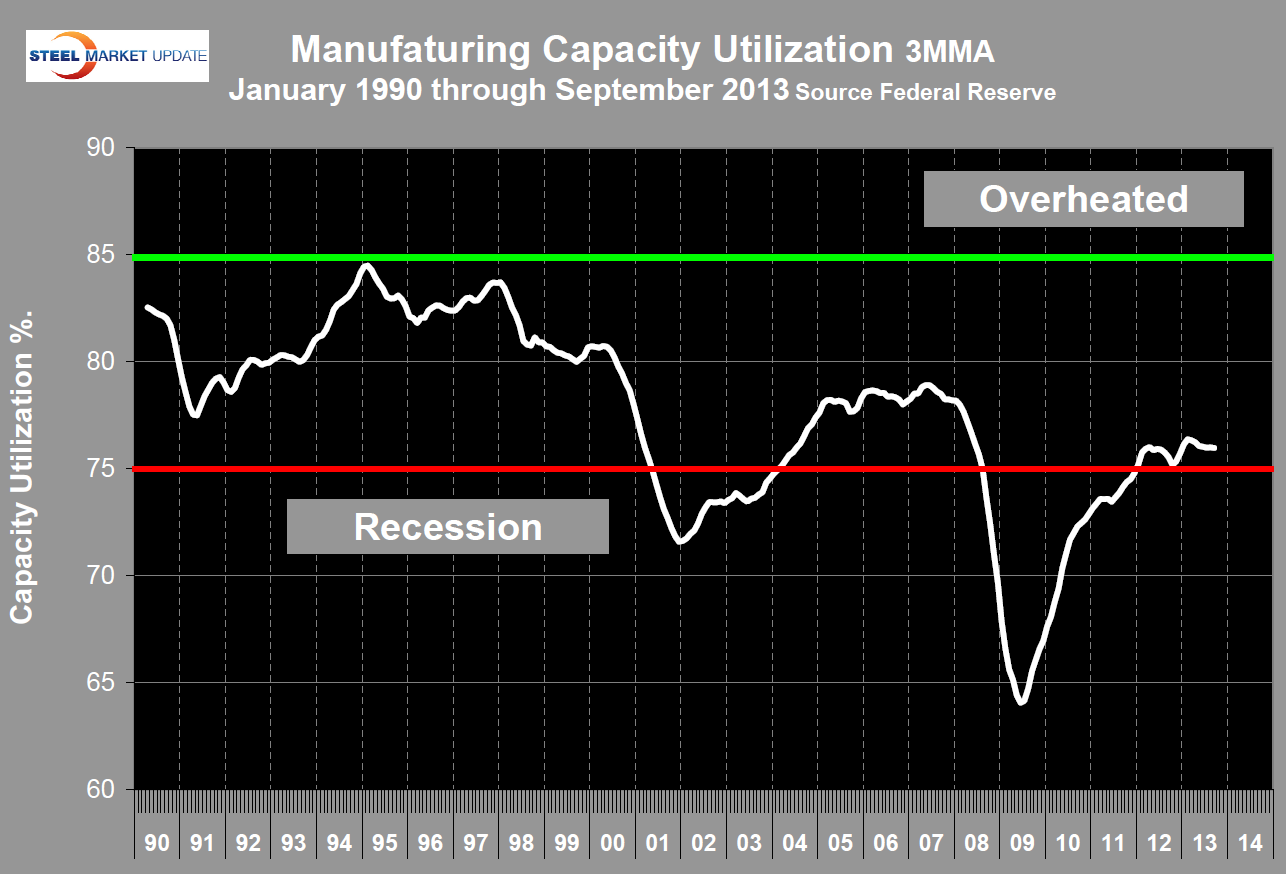
 Manufacturing capacity utilization was 76.08 percent in September, almost unchanged from 76.07 in August. The 3MMA declined slightly from 76.0 to 75.97 percent (Figure 2). There is evidently lots of unused capacity out there which is in line with the lackluster job creation numbers for manufacturing.
 Moody’s Economy.com summarized as follows: The top-line increase in industrial production in September matched our expectations, although the composition of the gain was somewhat surprising. There was still weakness in many of the durable and non-durable manufacturing categories, but auto-related and machinery production growth underpinned a modest rise in manufacturing output, while an overdue bounce in utilities output lifted industrial production overall. Mining also made a positive contribution to industrial production growth; it has done so in six consecutive months. A hefty 1.2% rise in business equipment production gives a bit of solace to economists worried that Washington’s bitter fiscal disputes were short-circuiting the U.S. recovery. However, this risk has not been fully dispelled. It could be the case that the effects of government dysfunction are merely taking longer to materialize in the data. Keep a close eye on business equipment production growth over the next few months. In the meantime, acrimonious partisanship has driven up borrowing costs for the US Treasury, thereby unnecessarily driving up the U.S. budget deficit. Nonetheless, rising business equipment production is a positive, and so is stronger growth overseas. Europe is exiting recession and there are encouraging signs that China’s economy is picking up. Improving foreign demand is expected to help maintain the faster rate of manufacturing production growth even as the support from autos diminishes.
SMU Comment: Manufacturing will consume an estimated 51 million tons of steel in the US in 2013 and is by far the largest steel consuming sector, followed by construction at 22 million tons. The slow but steady advance of the manufacturing indicators is good news for a similar performance of steel consumption.


