Market Data

September 29, 2013
August Durable Goods Analysis
Written by Peter Wright
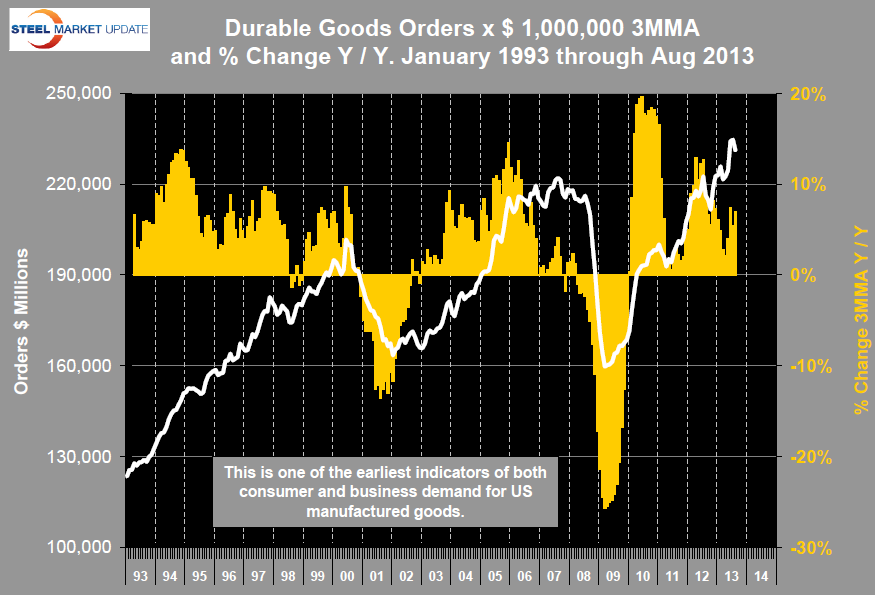
New orders for manufactured durable goods in August were almost unchanged from July. In hindsight the results for May and June were outliers on the high side driven by orders for civil aircraft. The three month moving average in August had negative growth of 1.5 percent compared to the three months through July. A better measure is the year over year growth rate of the three month moving average and by this measure growth in three months through August was 7.0 percent continuing a string of 44 consecutive monthly increases, (Fig 1).
The unabridged Census Bureau report was as follows.
New Orders:
New orders for manufactured durable goods in August increased $0.3 billion or 0.1 percent to $224.9 billion, the U.S. Census Bureau announced today. This increase, up four of the last five months, followed an 8.1 percent July decrease. Excluding transportation, new orders decreased 0.1 percent. Excluding defense, new orders increased 0.5 percent. Transportation equipment, also up four of the last five months, drove the increase, $0.5 billion or 0.7 percent to $67.9 billion. This was driven by Motor vehicles and parts, which increased $1.1 billion.
Shipments
Shipments of manufactured durable goods in August, up following two consecutive monthly decreases, increased $2.1 billion or 0.9 percent to $231.5 billion. This was at the highest level since the series was first published on a NAICS basis in 1992, and followed a 0.1 percent July decrease. Transportation equipment, also up following two consecutive monthly decreases, led the increase, $1.0 billion or 1.5 percent to $69.7 billion.
Unfilled Orders
Unfilled orders for manufactured durable goods in August, up six of the last seven months, increased $0.4 billion to $1,032.4 billion. This was at the highest level since the series was first published on a NAICS basis, and followed a 0.2 percent July increase. Machinery, up four of the last five months, drove the increase, $1.3 billion or 1.2 percent to $107.5 billion.
Inventories
Inventories of manufactured durable goods in August, up four of the last five months, increased $0.3 billion or 0.1 percent to $379.1 billion. This was at the highest level since the series was first published on a NAICS basis, and followed a 0.3 percent July increase. Transportation equipment, up fifteen of the last sixteen months, drove the increase, $0.4 billion or 0.3 percent to $117.3 billion.
Capital Goods
Non-defense new orders for capital goods in August decreased $0.1 billion or 0.2 percent to $75.9 billion. Shipments increased $0.3 billion or 0.4 percent to $73.8 billion. Unfilled orders increased $2.1 billion or 0.3 percent to $610.4 billion. Inventories increased $0.7 billion or 0.4 percent to $172.1 billion. Defense new orders for capital goods in August decreased $0.6 billion or 6.5 percent to $8.4 billion. Shipments increased $0.8 billion or 8.3 percent to $10.1 billion. Unfilled orders decreased $1.8 billion or 1.0 percent to $167.6 billion.


