Market Data

September 19, 2013
SMU Steel Buyers Sentiment Index Rises to +40
Written by John Packard
Steel Market Update conducted our mid-September flat rolled steel market survey this week. The survey began on Monday with an invitation to approximately 600 companies who are active participants in the flat rolled steel industry. Part of the survey includes questions regarding attitudes within the industry regarding how successful the respondents see their company both in the current market environment as well as three to six months into the future. The results are compiled in our SMU Steel Buyers Sentiment Index and Future Sentiment Index.
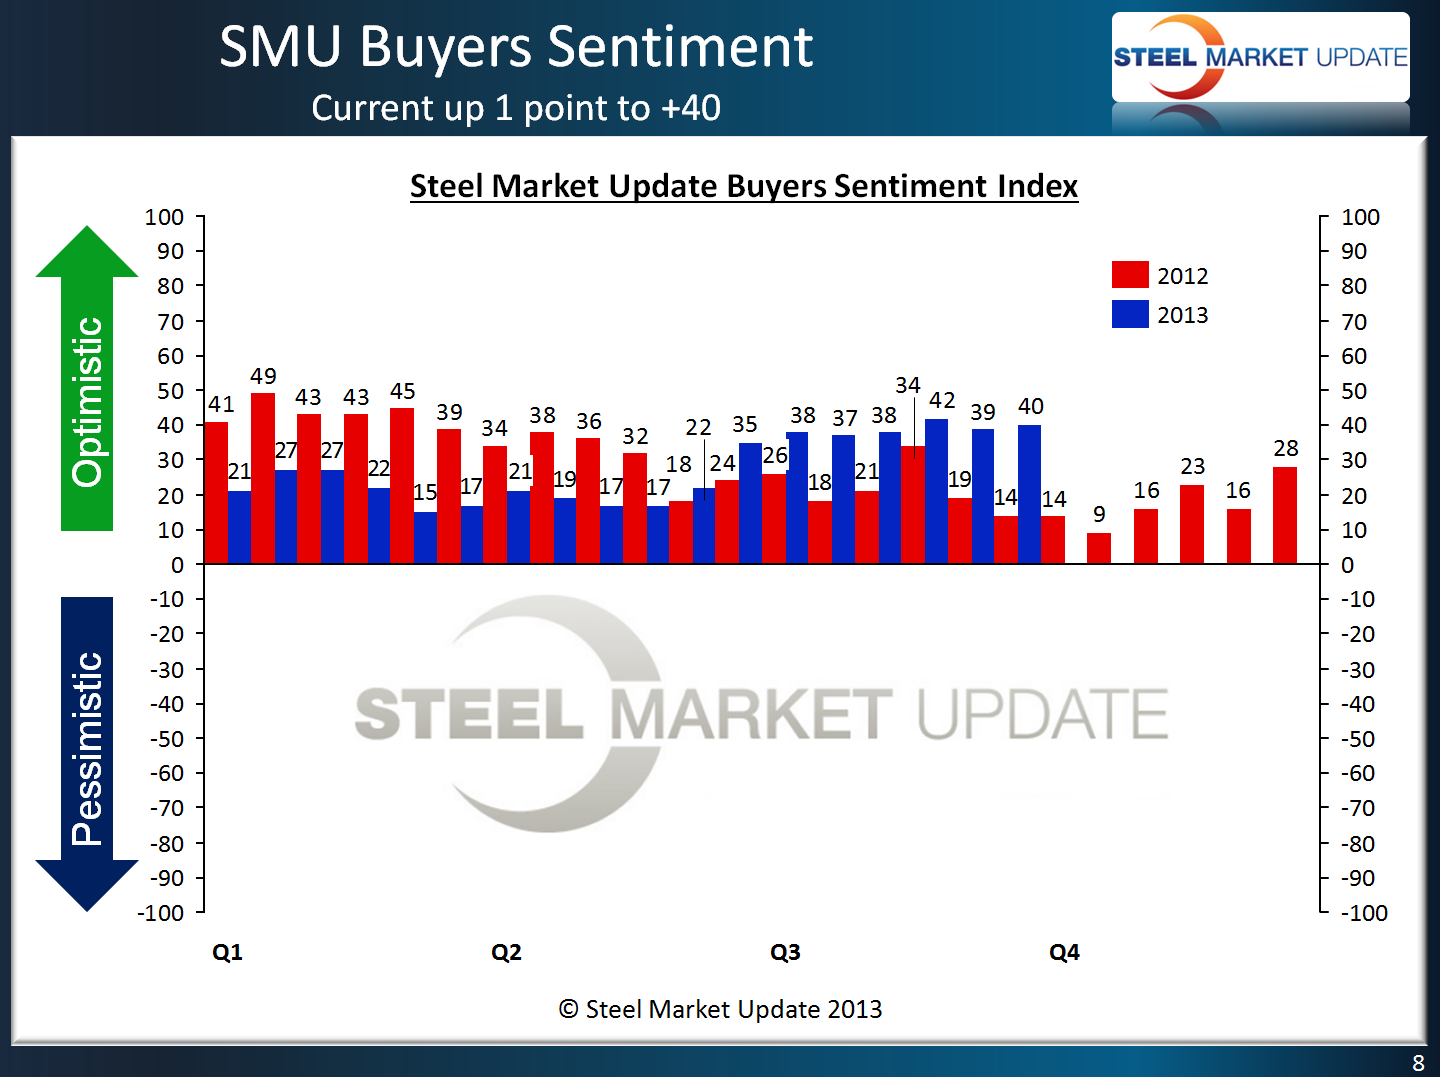
The industry continues to be optimistic about business conditions as our SMU Steel Buyers Sentiment Index was measured at +40 this week. This is an improvement of +1 point from early September but down 2 points from one month ago. However, when compared to mid-September 2012 the +40 is 28 points higher (more optimistic) than the +12 reported at that point in time.
On a three month moving average basis, SMU Steel Buyers Sentiment Index is now +39.00 a 2 point improvement in the 3MMA from mid-August 2013 when it was measured at +35.33. The +39.00 three month moving average is the highest reported since May 2012 when it was +39.17.
SMU Future Buyers Sentiment Index
Looking out three to six months into the future, steel buyers and sellers were very optimistic and our SMU Future Steel Buyers Sentiment Index was measured this week at +51. This is six points higher than the beginning of the month and 18 points more optimistic than this time last year.
SMU Analysis
The respondents to our survey have been clearly more optimistic since late May when the domestic steel mills began raising flat rolled steel prices. We are seeing excellent demand in automotive with our channel checks advising SMU that automotive forecasts for 2014 are for an increase of at least 500,000 more units than what we are seeing for 2013. There are signs of progress being made in the construction markets (See AIA Billings Index article below), agriculture markets, etc.
The biggest complaint we are hearing from those selling steel is the lack of margins (low profits) on the steel being sold due to competitive pressures (service center complaints not OEM).
“Business is there but selling prices are lower than they should be. With the holidays coming, it will slow up.” Service Center.
“Very up and down, but the delta between bid date and build date is growing increasing the exposure for material cost fluctuations.” Construction related manufacturing company.
“Overall business conditions appear to be fairly consistent.” Large manufacturing company with multiple subsidiaries.
“Three months into the future conditions will still be “fair”. Six months out is too far to predict, so hopefully we’ll see some improvement and move into the “good” range.” Toll processor.
About the SMU Steel Buyers Sentiment Index
SMU Steel Buyers Sentiment Index is a measurement of the current attitude of buyers and sellers of flat rolled steel products in North America regarding how they feel about their company’s opportunity for success in today’s market. It is a proprietary product developed by Steel Market Update for the North American steel industry.
Positive readings will run from + 10 to + 100 and the arrow will point to the right hand side of the meter located on the Home Page of our website indicating a positive or optimistic sentiment.
Negative readings will run from -10 to -100 and the arrow will point to the left hand side of the meter on our website indicating negative or pessimistic sentiment.
A reading of “0” (+/- 10) indicates a neutral sentiment (or slightly optimistic or pessimistic) which is most likely an indicator of a shift occurring in the marketplace.
Readings are developed through Steel Market Update market surveys which are conducted twice per month. We display the index reading on a meter on the Home Page of our website for all to enjoy.
Currently we send invitations to slightly more than 600 North American companies to participate in our survey. Our normal response rate is approximately 120-170 companies. Of those responding to this week’s survey 50 percent were manufacturing companies (down 2 percent from the previous survey’s 52 percent), 39 percent were service centers/distributors (up 4 percent from 35 percent at the beginning of September) and the balance was made up of steel mills, trading companies, toll processors and suppliers to the industry (such as paint companies).
Steel Market Update does canvass those being invited to participate in order to confirm their active participation in the flat rolled steel business. Our list is updated at least once per month and we are adding new companies on a continuous basis.


