SMU Data and Models

Historical SMU Price Momentum Indicator Results
Written by John Packard
August 29, 2013
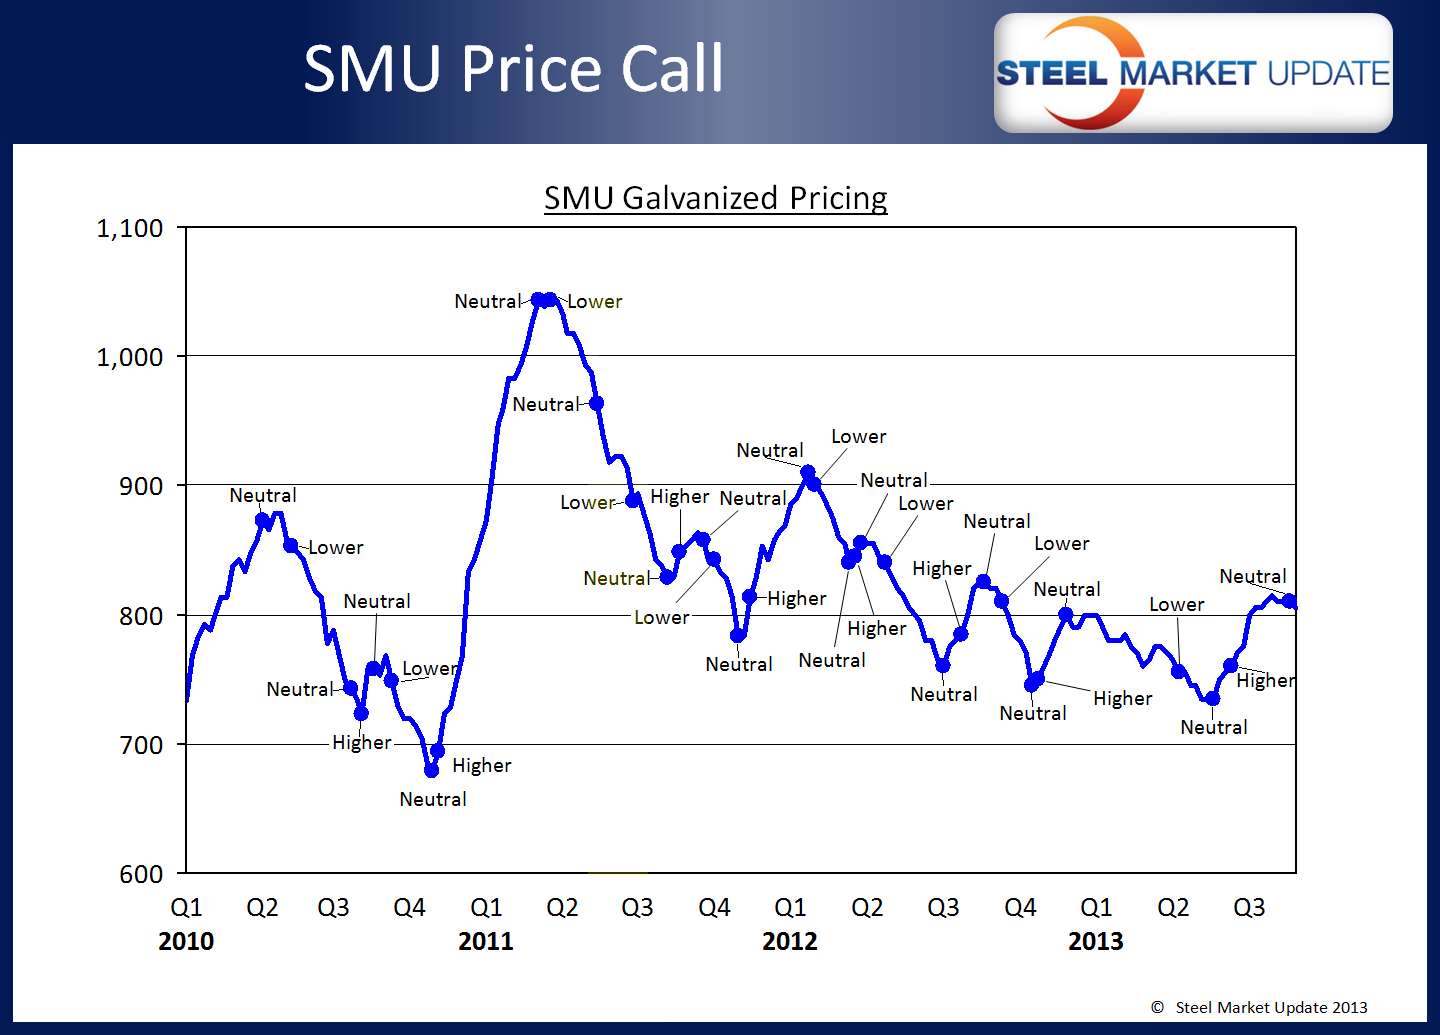
We had one of our members ask about the accuracy of the Steel Market Update (SMU) Price Momentum Indicator as we move between Higher, Neutral and Lower Momentum forecasts. Here is a graph of SMU hot rolled pricing (average) and our Momentum forecasts:

John Packard
Read more from John PackardLatest in SMU Data and Models

SMU Survey: Sheet lead times ease further, plate hits one-year high
Steel buyers responding to this week’s SMU market survey report a continued softening in sheet lead times. Meanwhile, plate lead times have moderately extended and are at a one-year high.

SMU Survey: Buyers report more price flexibility from mills
Nearly half of the steel buyers responding to this week’s SMU market survey say domestic mills are showing increased willingness to negotiate pricing on new spot orders. This marks a significant shift from the firmer stance mills held in prior weeks.

SMU Survey: Buyers’ Sentiment Indices fall
Current Sentiment Index dropped six points to +42 this week compared to two weeks earlier. It has fallen in every successive survey since reaching a 2025 high of +66 on Feb. 19.

March service center shipments and inventories report
Steel service center shipments and inventories report through March 2024.

Apparent steel supply contracts in February
The amount of finished steel that entered the US market in February receded from January’s peak, according to our analysis of Department of Commerce and American Iron and Steel Institute (AISI) data.