

Product
August 12, 2013
Steel Indices Methodologies: Why Prices Can Vary
Written by John Packard
Over the past decade more steel indices have emerged in the steel commodities markets. All serve the same objective of providing pricing benchmarks for buyers and sellers of steel – and, in recent years, for the financial settlement of derivative contracts. As the number of indices grew so did the questions surrounding
the validity of the price assessments.
Steel Market Update recently attended a program conducted by Platts and their sister company, The Steel Index (TSI) in New York City. The topic of methodology – the collection and analysis of the gathering of pricing information – and the differences in the techniques developed by each organization were raised during their presentations.
Upon our return to our corporate headquarters, we sat down to review the methodology and transparency of the techniques used by each of the indices referenced in the SMU Comparison Price Indices (CPI) table published each Sunday evening (see monthly version below).
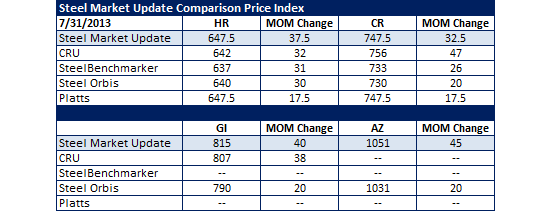
When looking at our CPI table it is important to understand what the numbers referenced mean. The purpose of this short article is to address some of the questions we (and you) might have in that regard.
Steel Market Update intention is to expand upon this article with a “white paper” which we will offer to our readers once our new website comes online later this summer. It will be part of our eLearning experience which is a core piece being developed in our new website.
Steel Market Update believes the key factors to consider when reviewing indexing methodologies are:
• product description,
• price assessment FOB points,
• minimum & maximum order quantities considered for data collection,
• how discounts and extras (including freight) are considered,
• whether the index is using mill source pricing data (and how large can one data provider be to any pricing series),
• the survey collection process,
• confidentiality of sources,
• and if the data providers are auditable.
As we undertook our investigation, SMU found that after the initial description of the benchmark hot rolled product – very little else was the same from index to index. Review the table below and then we will provide a short analysis on the other side.
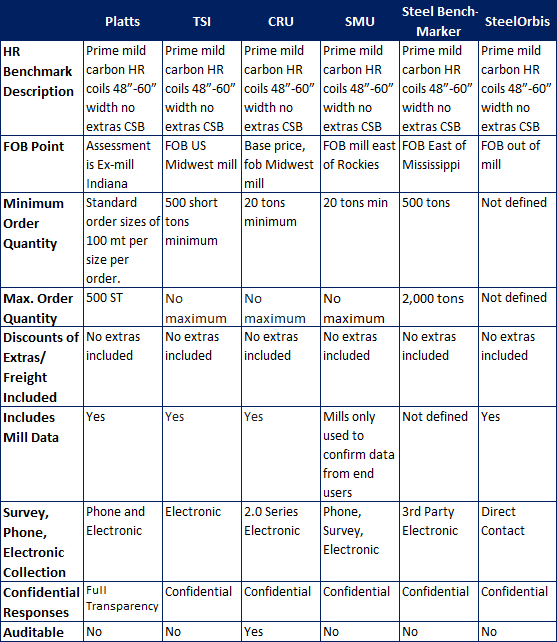
The first point to notice is that all of the indices have the same basic HR benchmark: Prime mild carbon HR coils 48”-60” width, CSB, no extras. This is based off the ASTM A 1011-06a Commercial Type B standards.
As for FOB points – the point at which the steel originates can vary from index to index. We have FOB points referenced as east of the Rockies, east of the Mississippi, Indiana, and Midwest mills. These differences are important because of the variance in geographic scope and collection points. Indices such as Platts and CRU will “normalize” or adjust pricing points received outside of the FOB Zone to accommodate freight issues. This is one reason why you may see a price difference from one index to the next.
Minimum and maximum orders vary by index. This can also have a tremendous impact on data collection – especially when markets are at their peak or trough and about to turn. During these periods large tonnage data points become difficult to find and quantify. Most of the indices have some form of maximum normalizing of the data with a cap typically between 30 to 40 percent. Meaning no matter how large a volume submission, it can’t account for more than 30 percent or 40 percent of the total. It is interesting to note the differences between index minimums and maximums though. For instance, Platt’s survey data is capped at 500 tons, whereas that figure represents TSI and SteelBenchmarker’s minimum starting point. SMU and CRU use the mill minimum order quantity as the beginning of their data collection points (20 tons).
Another commonality that the indices share is in regard to extras. Freight, quality, or chemistry extras that may have an effect of the actual value of the commodity are factored out by all of the indices. Hot rolled and all of the other commodities are judged on “base price” without extras.
How mill pricing data is used will vary from index to index. CRU and others utilize a “mill dump” whereby data is collected en masse from a number of domestic mills. Others, such as SMU, use the information gathered from mill sources as a confirmation of the data collected directly from end customers.
In terms of data collection, there are a number of methods used: direct phone contacts, electronic – data providers send information directly to collector and through the use of surveys. Most of the indices utilize a combination of phone and electronic/web based collection methods as well as surveys. Issues of confidentiality, standardization, and efficiency all factor into the effectiveness of one method over another.
All of the indices are confidential with the exception of one: Platts. Platts has advised their indices are fully transparent if a number comes into question. Platts seems to be the only one that fully embraces full transparency.
Recently the CRU indices were put in the spotlight as they announced they would exercise the clause in their contracts which allows them to audit data providers. At this moment they are the only index of the ones we are reviewing today which have fully auditable data.
Steel Market Update will expand on this topic in a “White Paper” which we will provide to those going to our new website when it comes online later this summer. Until then, if you have any questions you are welcome to contact Steel Market Update or any of the indices mentioned in our article.


