Market Data
March 25, 2013
SMU Key Market Indicators: Forecast is for Better Times Ahead
Written by Peter Wright
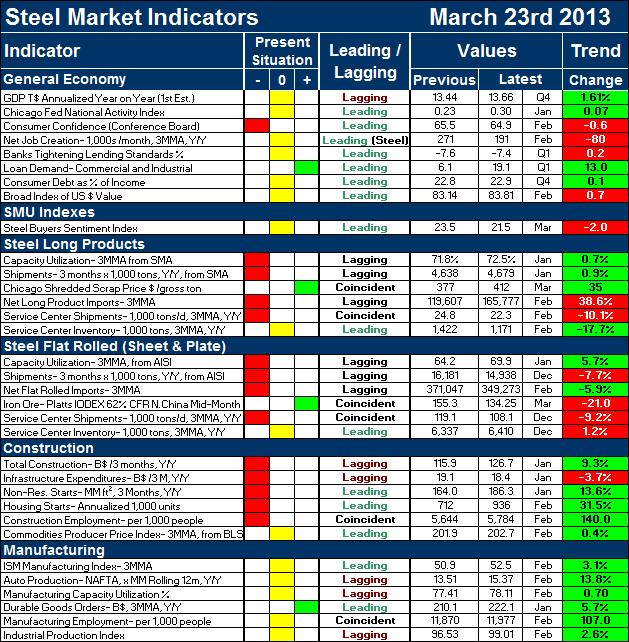
Key Market Indicators March 23rd 2013
The key indicators chart is designed to give a snapshot of the steel market on a specific date. The chart is stacked to separate the primary indicators of the general economy, of proprietary Steel Market Update indices, of both flat rolled and long product market indicators and finally of construction and manufacturing indicators. The indicators are classified as leading, coincident or lagging as indicated.
Columns in the chart are designed to differentiate between the current situation and the direction in which the market is headed. The present situation is sub-divided into, below the historical norm (-), (OK), and above the historical norm (+). The “Values” section of the chart is a quantitative definition of the market’s direction. In cases where seasonality is an issue, the evaluation of market direction is made on a three month moving average basis and compared year over year to eliminate seasonality. Where seasonality is not an issue concurrent periods are compared. The date of the latest data is identified in the third values column. Values will always be current as of the date of publication. Finally the far right column quantifies the trend as a percentage or numerical change with color code classification to indicate positive or negative direction.
The total number of indicators considered at present is 33. On March 23rd, the present situation of four of the indicators was positive and fourteen were negative. This means that by historical standards the steel market is still not great. No surprise there. However looking at the distribution of leading, coincident and lagging indicators is encouraging. Of the 14 negative present situation indicators, eight were lagging. Only three of the fifteen leading indicators were red. This overall trend is confirmed by a quantitative analysis of the value of each indicator over time and is shown in the “Trend” column. In this case twenty one indicators were trending positive and twelve were trending negative. Five of the six construction indicators, led by the private sector are now trending positive. Only infrastructure is trending negative. All of the manufacturing indicators are trending positive.
Of particular interest in the latest data is the capacity utilization of the flat rolled mills. The latest data available from AISI is for January which was the month when Severstal’s expansion and the closure of RG steel was recognized. This moved the capacity utilization number up from 64.2 percent to 69.9 percent. For those who would question this number the methodology was as follows. The new AISI capacity number for all steel products is 124,600,000 annual tons. Long product capacity based on a history of shipments developed by the SMA is 33,307,000 tons, leaving a flat roll capacity of 91,300,000 tons. The three month rolling average of flat rolled shipments from AISI through January was 63,781,000 annualized tons which gives a flat rolled capacity utilization of 69.9 percent.
The key indicators analysis confirms our experience that the current market is not great but tells us that trends which are quantified are moving in the right direction. We believe a continued examination of both the present situation and direction will be a valuable tool for corporate business planning.