Product
March 1, 2013
SMU Key Market Indicators – NEW
Written by John Packard
Written by: Peter Wright
Key Market Indicators
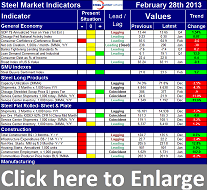
 This chart is a work in progress and is designed to give a snapshot of the steel market on a specific date, which in this case is February 28th 2013. The chart is organized vertically to describe the primary indicators of the general economy, of proprietary Steel Market Update indices, of both flat rolled and long product market indicators which are generally of a current nature and finally of construction and manufacturing indicators which are a combination of lagging and leading.
Horizontally the chart is designed to differentiate between the current situation and the direction in which the market is headed. The present situation is sub-divided into, below the historical norm (-), OK, and above the historical norm (+). The “Values” section of the chart is a quantitative definition of the market’s direction. In cases where seasonality is an issue, the evaluation of market direction is made on a three month moving average basis and compared year over year to eliminate seasonality. Where seasonality is not an issue concurrent periods are compared. The date of the latest data is identified in the third values column. Values will always be current as of the date of publication. Finally the far right column quantifies the trend with color code classification to indicate positive or negative direction.
The total number of indicators considered at present is 29. On February 28th, the present situation of four of the indicators was positive and eleven were negative. In terms of market direction, seventeen indicators were trending positive and twelve were trending negative.
This analysis confirms our experience that the current market is not great but tells us that trends which are quantified are moving in the right direction. Steel markets usually move like molasses but we believe a continued examination of both the present situation and direction will be a valuable tool for corporate business planning.


